|
OK, here's a sequence from the latest GFS showing 6-hour precip and the freezing line. This starts at 1 PM next Monday and each image is every 6 hours through 7 PM Wednesday. The light blue line is 35ºF and the darker blue line is 32ºF, the red line is 0ºF. 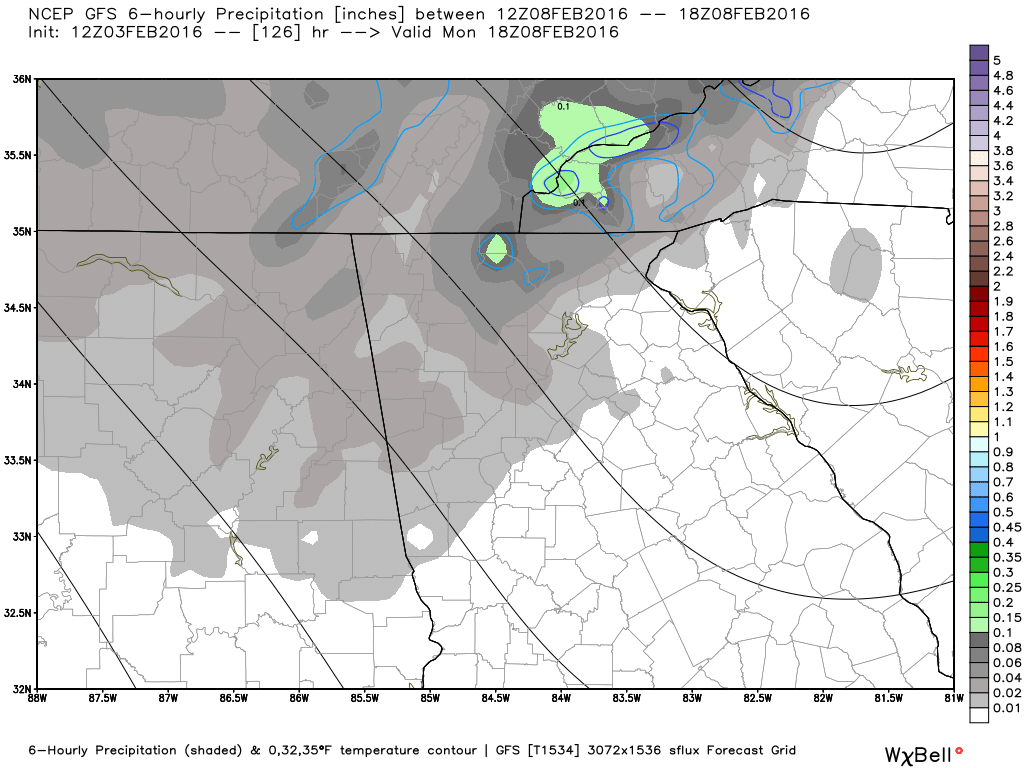 1 PM Monday 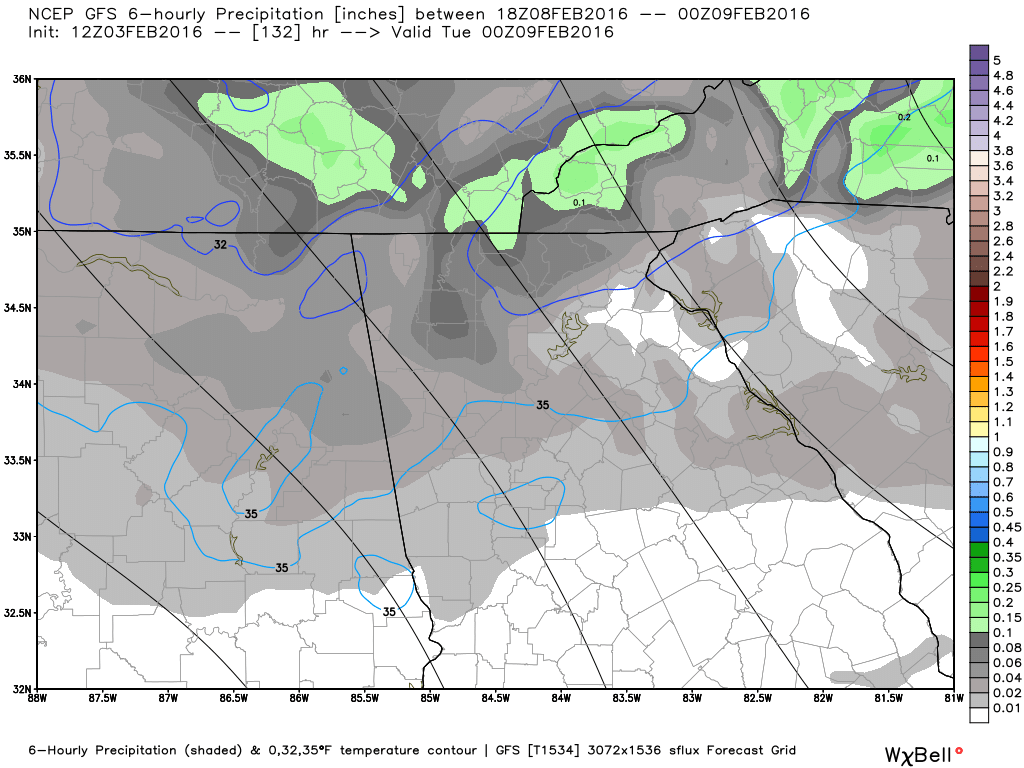 7 PM Monday 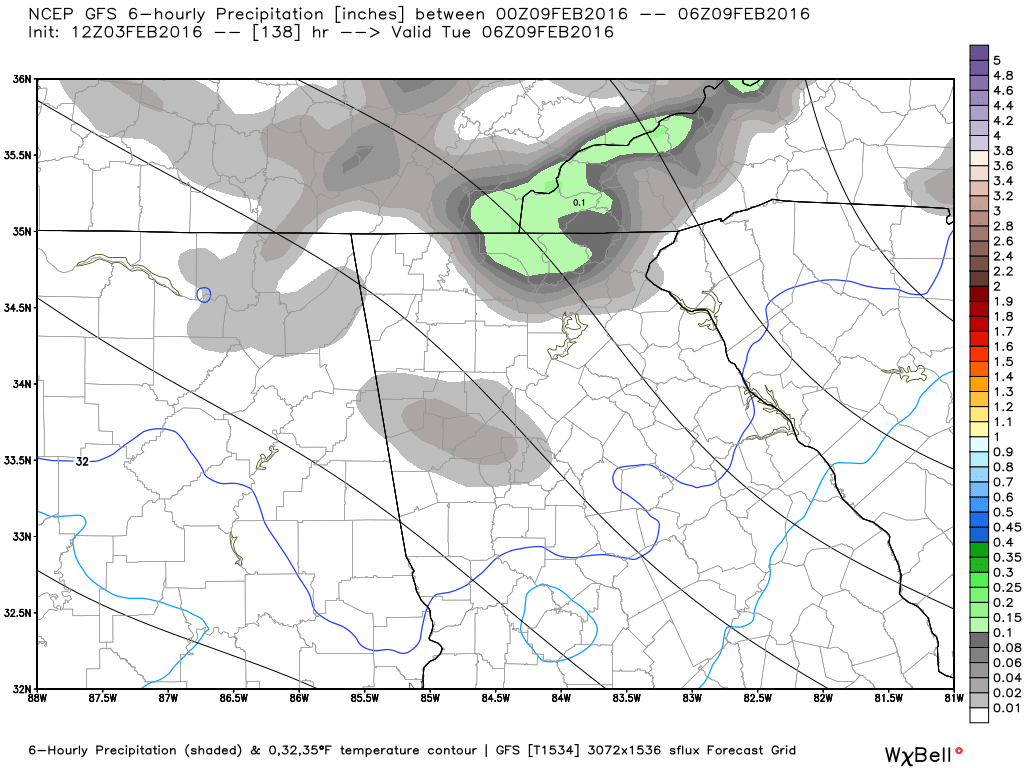 1 AM Tuesday 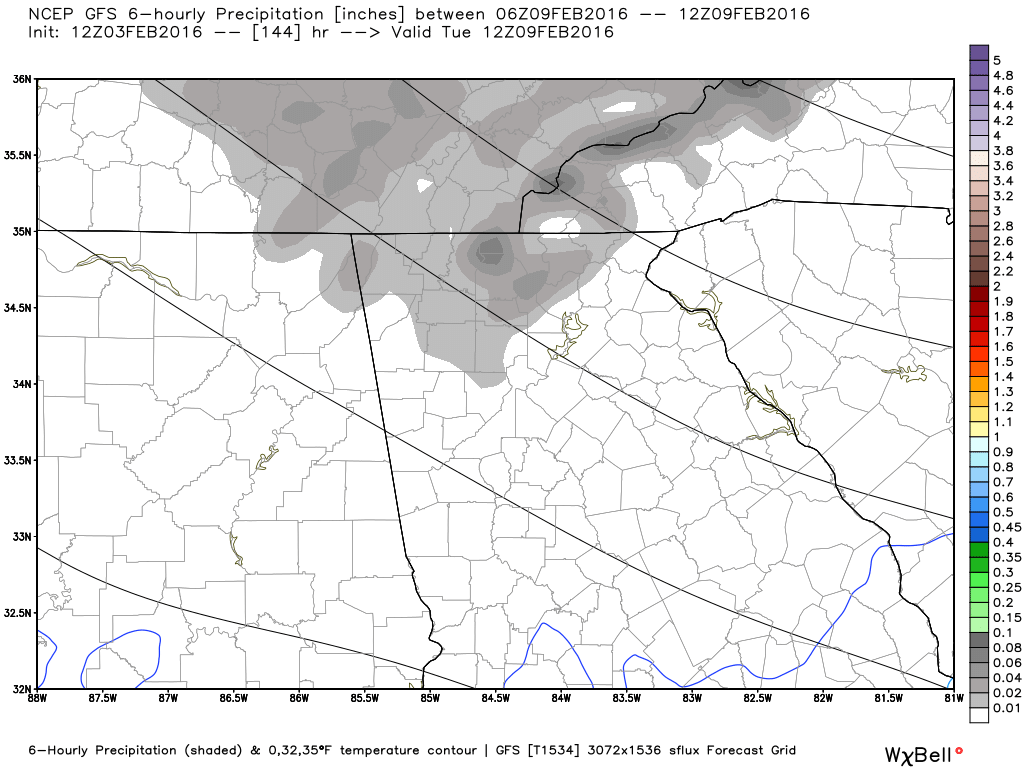 7 AM Tuesday 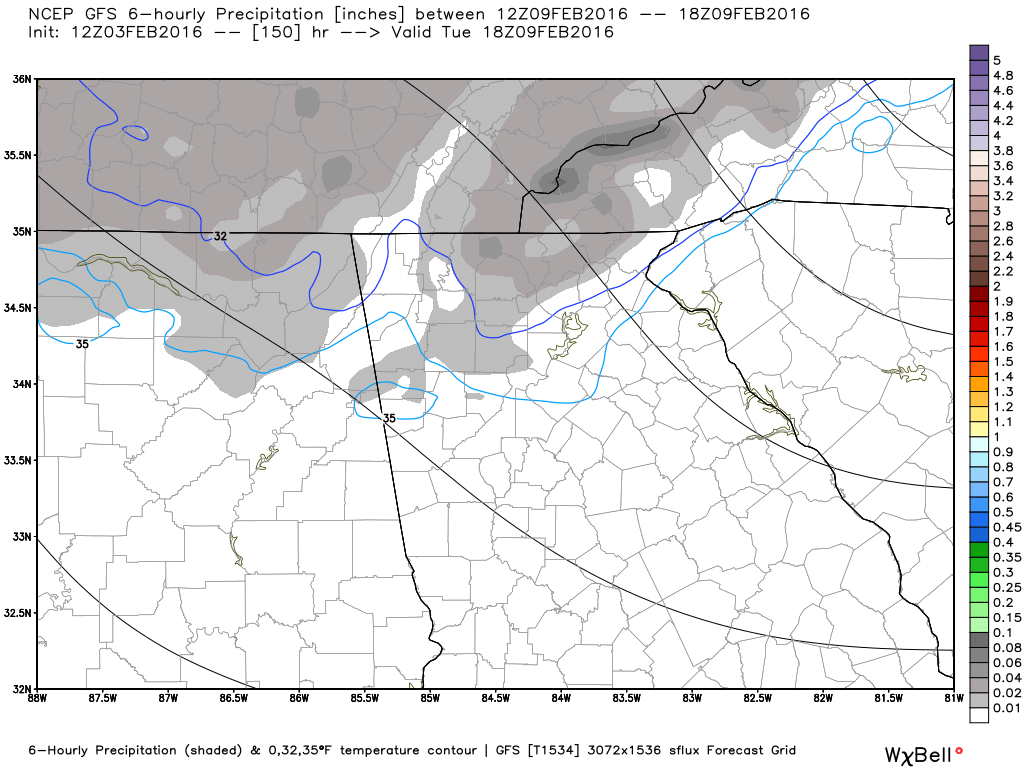 1 PM Tuesday 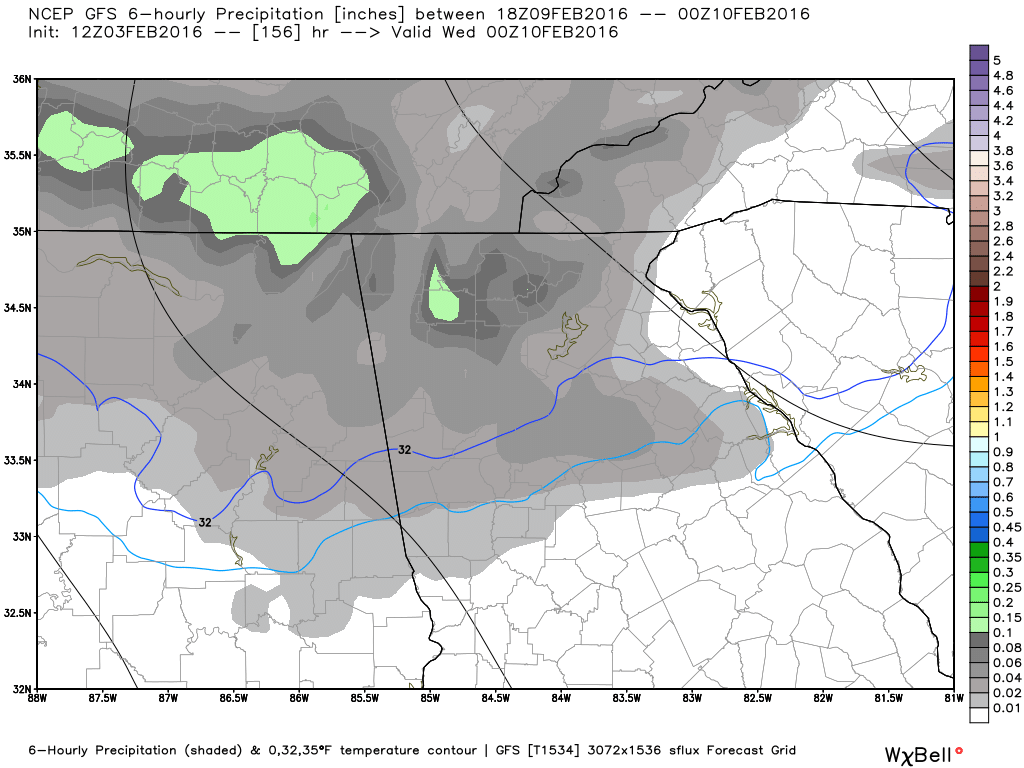 7 PM Tuesday 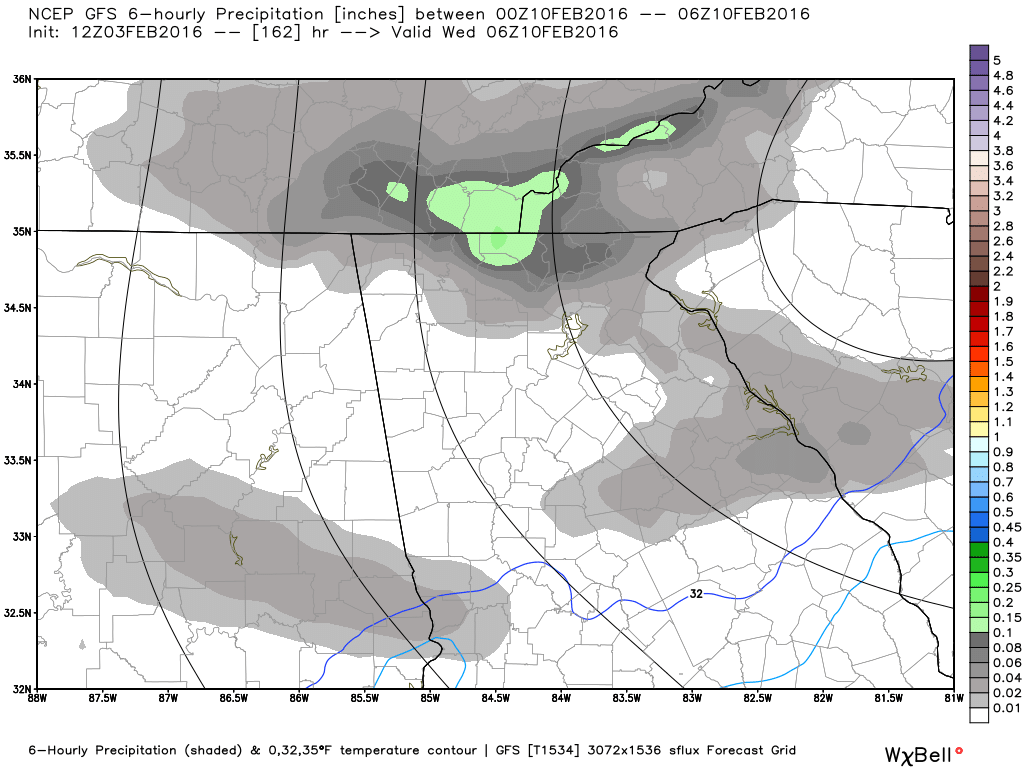 1 AM Wednesday 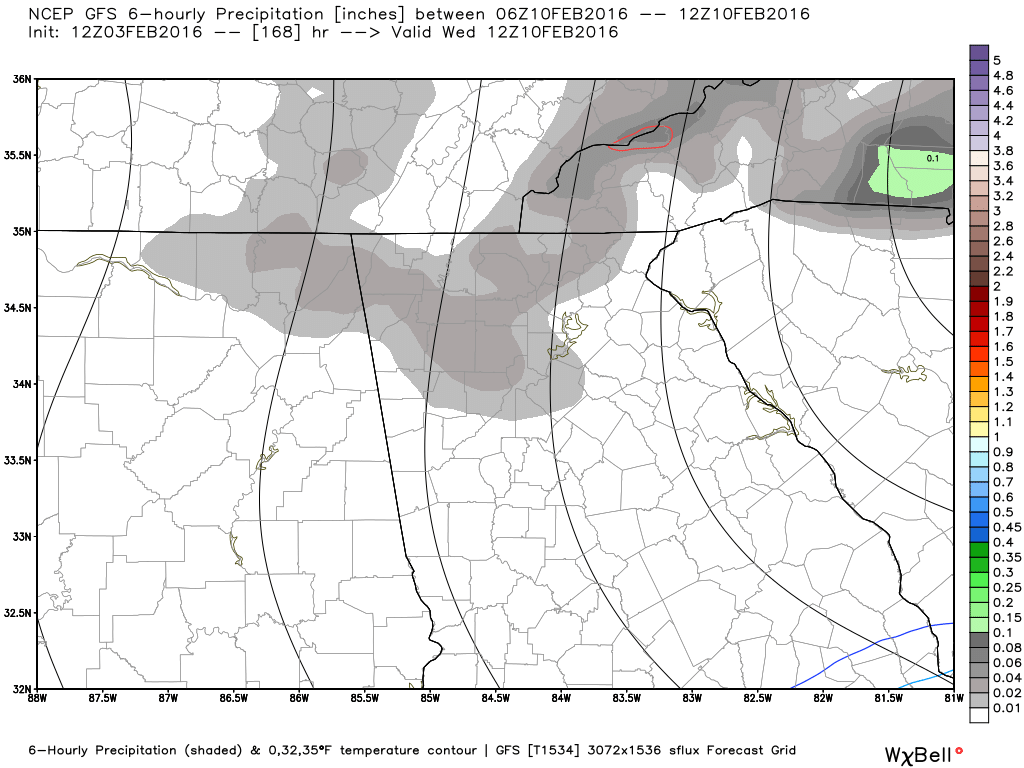 7 AM Wednesday 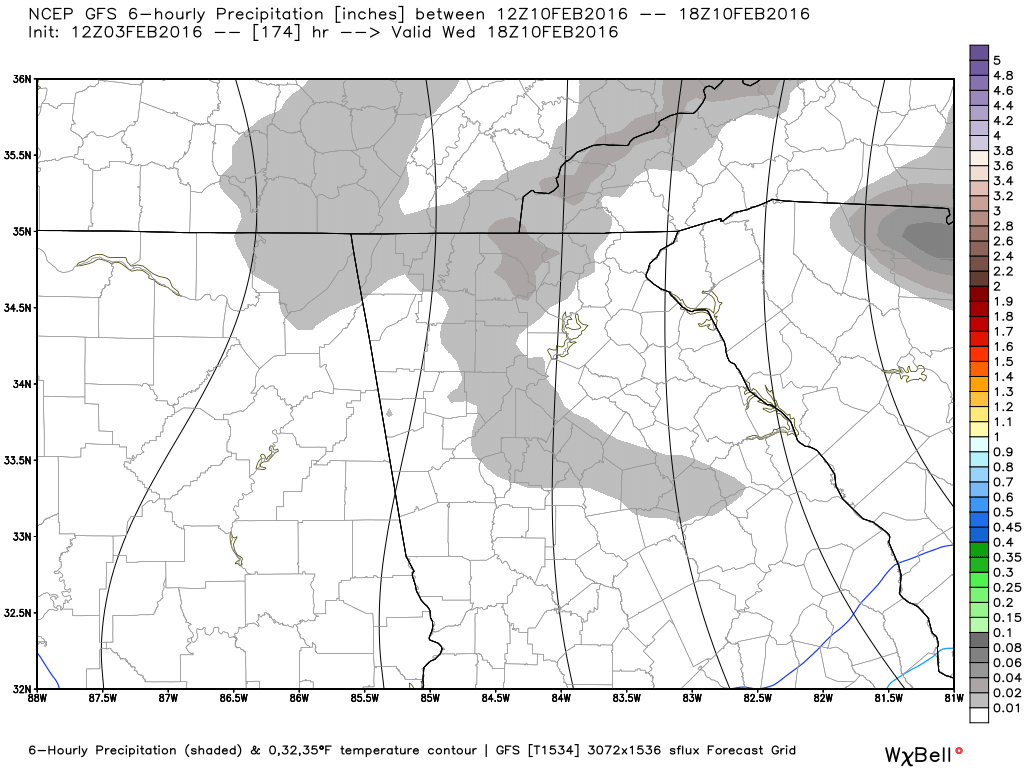 1 PM Wednesday 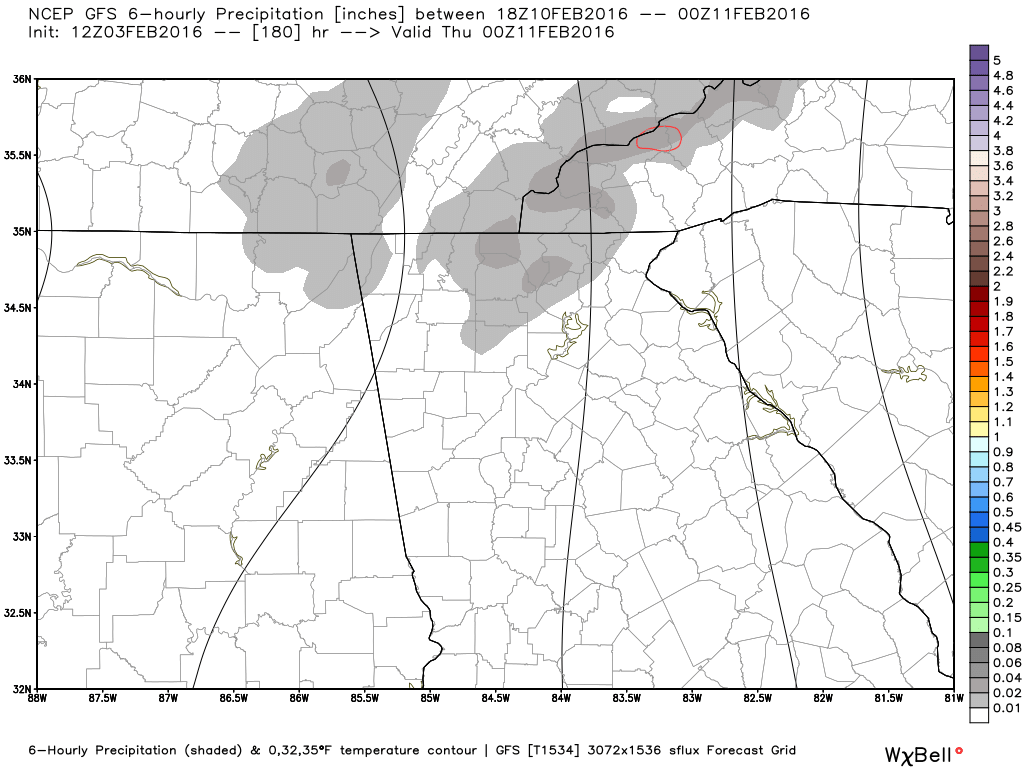 7 PM Wednesday Who doesn't have one? Weather apps are everywhere and everyone believes them, so they must be good right? I would say don't get me started about weather apps but I guess that's too late now. :-) I use more than one weather app, because none of them do everything, but some of them do certain things very well. It really comes down to your needs and how much you actually follow the weather. So I thought I would share the apps I use on my phone and tablet, and the reasons why. Hopefully this will help you make a more informed decision about what you might want to use for your own personal weather information. I have seen some of the forecast that comes from some apps and in many cases, I wouldn't show those to anyone. You want a forecast that has been touched by human hands, not one that a computer model spits out verbatim. Radar
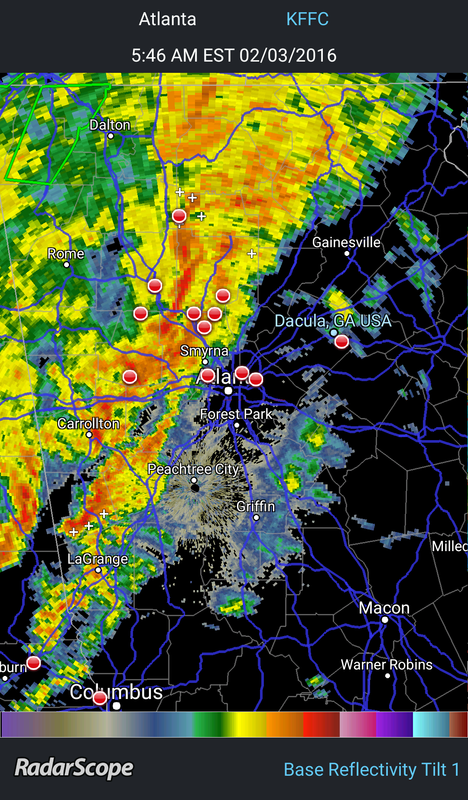
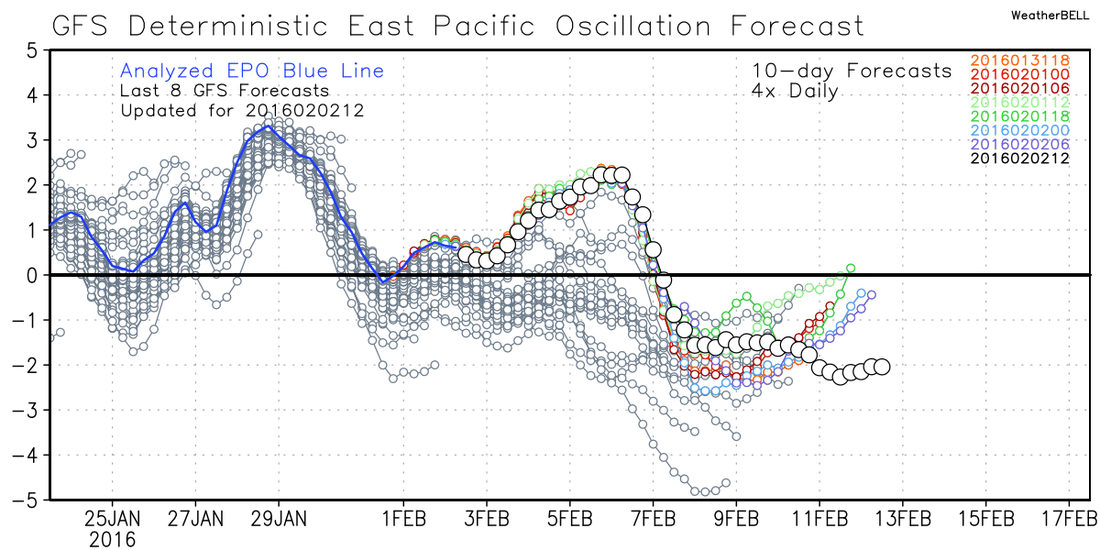
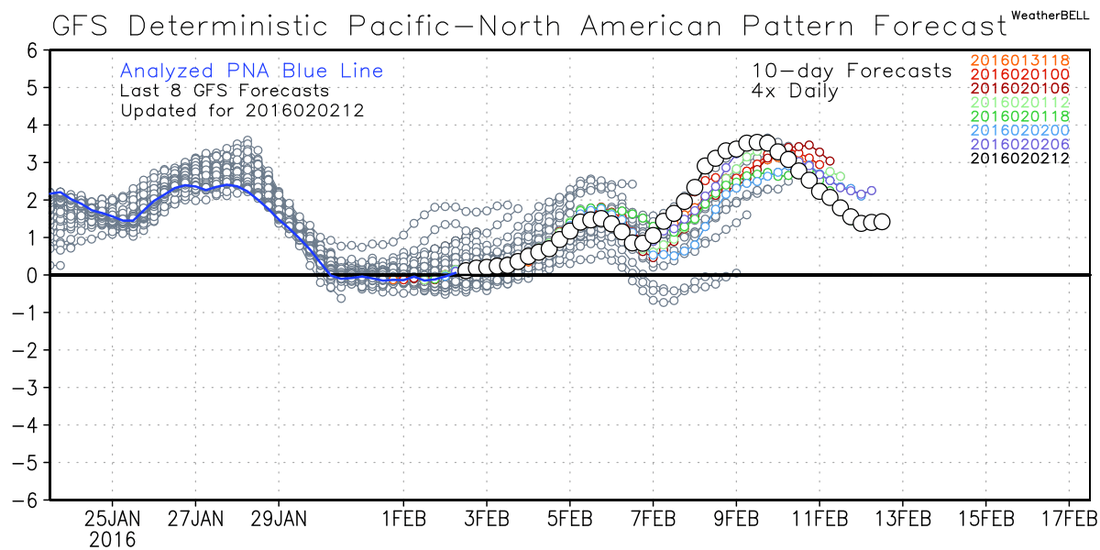
RadarScope is a specialized display utility for weather enthusiasts and meteorologists that allows you to view NEXRAD Level 3 radar data and severe weather warnings. It can display the latest reflectivity, velocity, and other radar products from any NEXRAD radar site in the United States, Guam, Puerto Rico, as well as Canada.These aren't smoothed PNG or GIF images, this is real Level 3 radar data rendered in its original radial format for a high level of detail. For those National Weather Service radar sites which have been upgraded with dual-polarization technology, RadarScope displays most of those products as well. The only other App that most people need...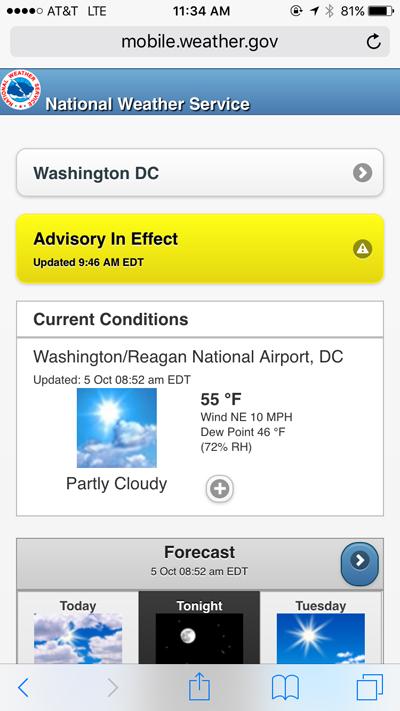 Weather apps that do it all are all over the place, and honestly, there are so many it's just not possible to try them all. What I use and recommend is the NWS Mobile app. If you need everything all bundled up in one package, this is it. The app will use the location of your device as the default starting page, the forecast is more accurate, and you have everything that most people need right at their fingertips. There are a lot more options available than what you see in this screenshot. This is not a true app, it's a webpage that functions like an app, so to add it to your device so that it behaves like an app requires just a couple of simple steps. The directions on how to get to the page and add it to your Apple or Android device can be found by clicking here. Other AppsI used another app called Storm Chasers Toolbox , but a few of the links are broken in it and you can't seem to get it anymore. I liked it because it was an easy way to get to the mobile version of the Storm Prediction Center Mesoanalysis maps. So I have added the Mesoanalysis page to my devices by going to the mobile page (click here), and then followed the same directions that I used to add the NWS mobile application to my device. (See the link for the directions above). 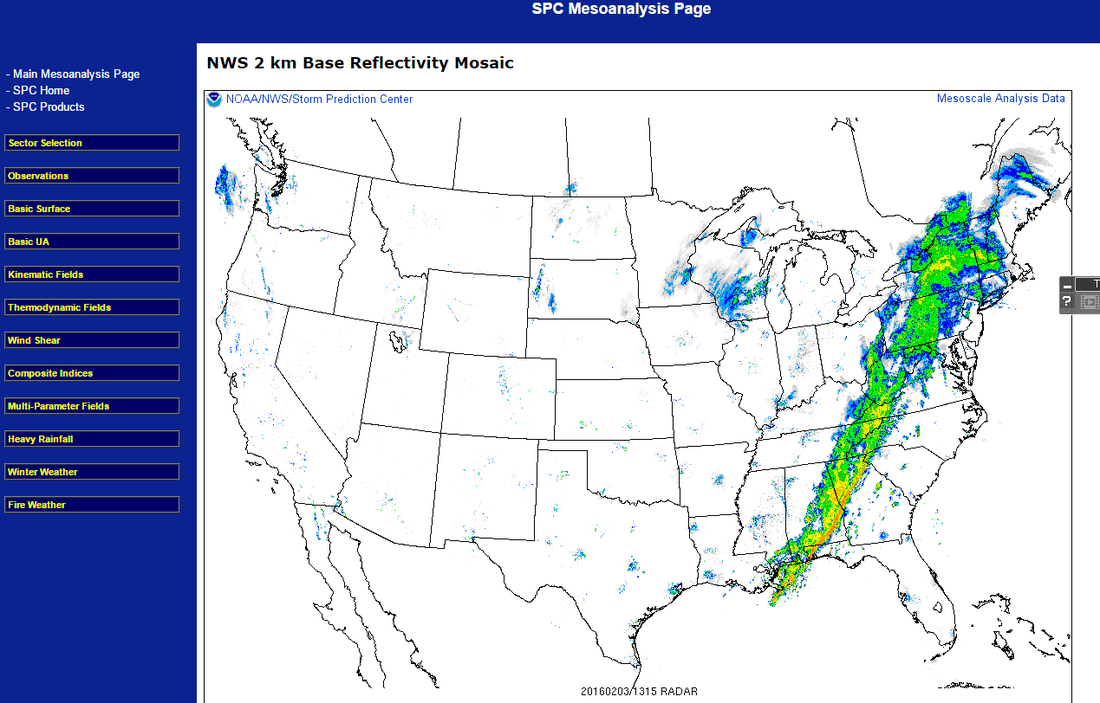 No offense to any media outlet, I'm sure some of their apps have some good points, but if you want accurate weather, straight from the source with no ads or gimmicks, the apps above are all you need. I wanted to take a look at the Euro ensembles and attempt to show you some issues that may or may not bring us some winter weather, but more to show you some of the things that have to be considered this far out. There are so many things that can go wrong that would keep us from getting frozen precipitation here in Georgia, and there are a million details that can mess things up when you get close to the time of the event, but in this post, I wanted to touch on the larger scale features that can lead to a winter storm... or not. Here's the first image. I've circled two pieces of energy that we are focused on, one dropping down from the northern stream, and the bottom one riding along the southern stream. Ideally, what we would like to see is the two pieces join or "phase" together and make us a nice big bowling ball storm that rolls along the Gulf coast... at least that's the idea we need to make a big snow storm. 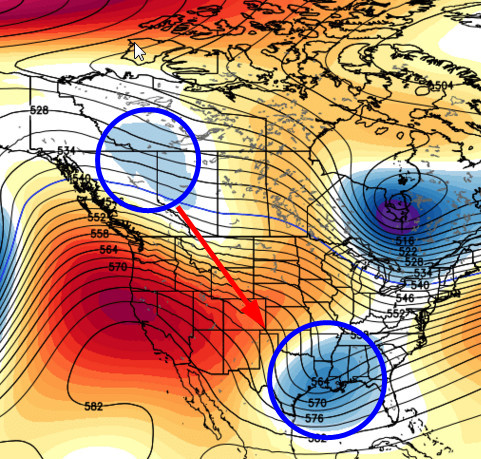 A couple of things to note here. One, we have good blocking out over the west coast, this is a +PNA/-EPO ridge, which is exactly what we need to slow down the flow off of the Pacific, the the GFS teleconnections are showing just that (see images below). I would prefer to see the ridging more vertical (versus the yellow line), because the way it's depicted by the model tends to make the energy dropping down from Canada slide more east than south, and you can see how far east that ridge is. In the ideal world, the lower piece of energy would be further west and the northern piece would drop more south toward Texas. So at least on this run... the timing and position is not there. 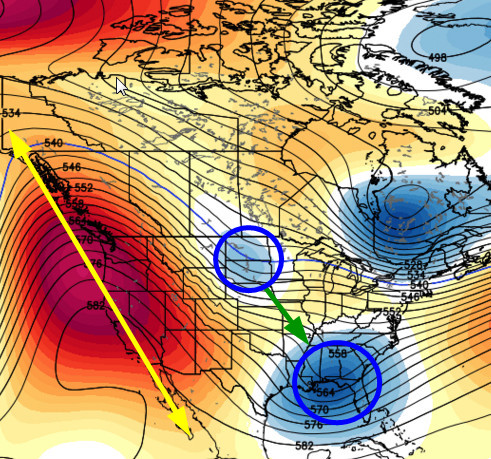
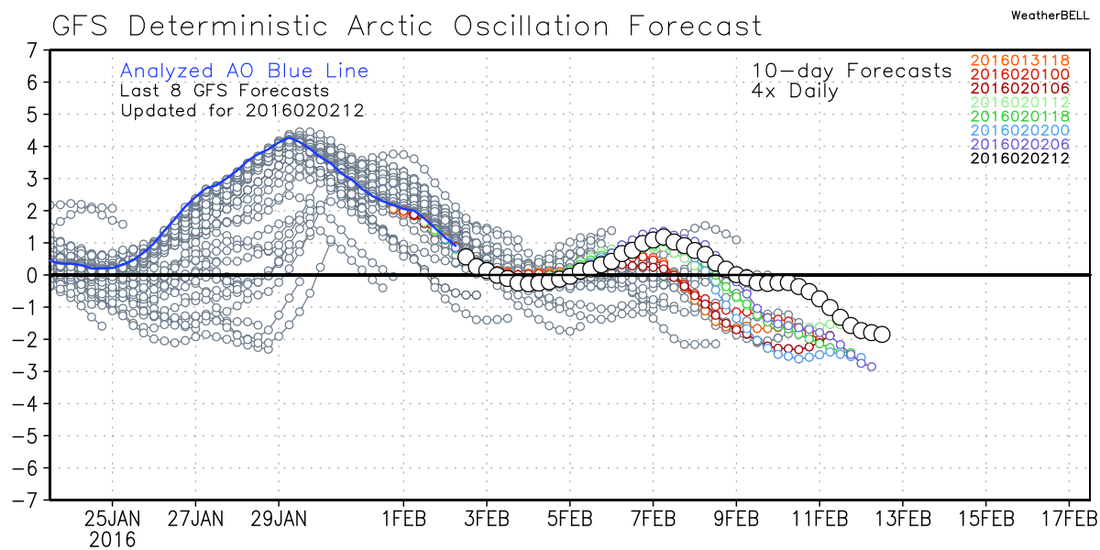
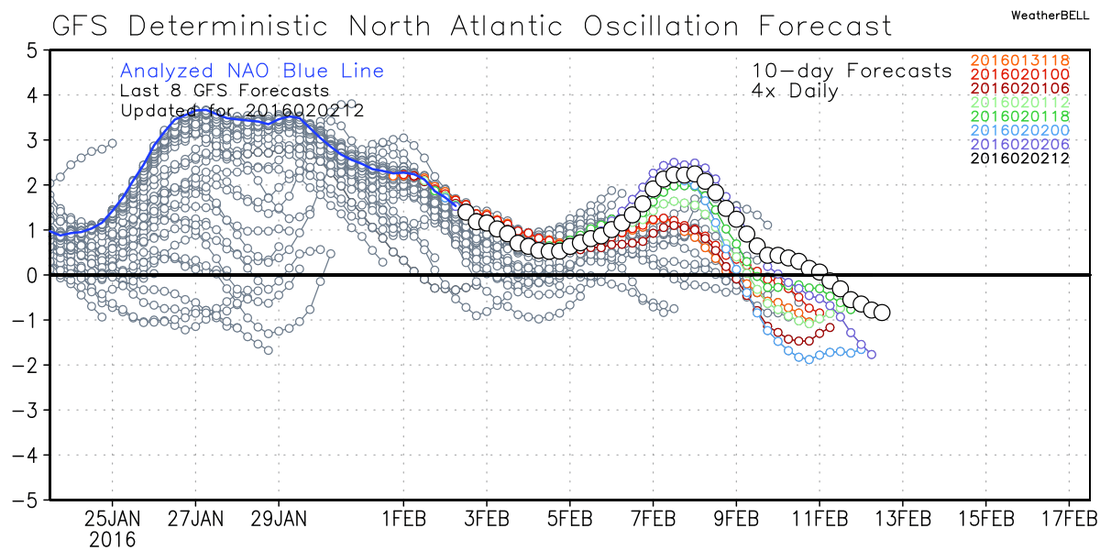
As the EPO and PNA do their dirty work, the AO (Arctic Oscillation) and NAO (North Atlantic Oscillation) are also forecasted to go negative, which are all positive (no pun intended!) signs for locking in some cold air and providing some chances for frozen precip.
In this next frame, you can see the two pieces beginning to merge or phase. The bad part is that the lower bundle of energy is too far out in front and the upper wave is too far east, so the timing and position is just a little off, at least as it appears for us in Georgia. 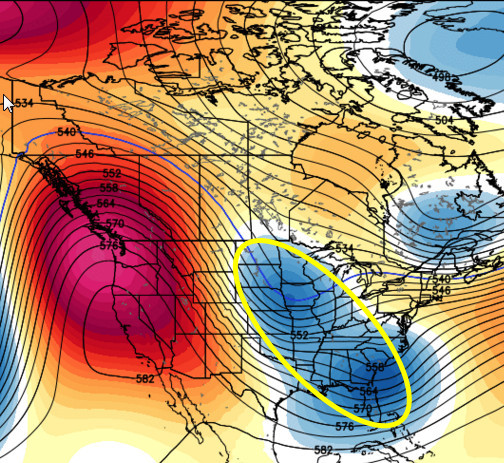 Here, the two pieces have merged and we now have one larger system. Wonderful you say? Not so quick... and here's the problem. The strongest part of the trough is now over Missouri, when for us, it needs to be along the Gulf coast. At this stage of the game, this looks more like a clipper type system versus the Miller A that we want to see. 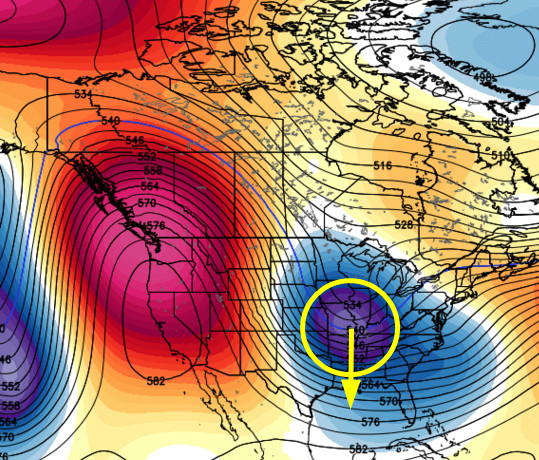 In this final frame, the two pieces have now completely merged and you can see a much stronger and larger trough. Still... since the timing was off, the trough is still trying to strengthen as it begins to rotate and pull away. You can see that it still has a positive tilt as it moves across Georgia and we would ideally like to see that as a negative tilt trough, or a tilt the other direction (top of line tilted to the left or west more). Couple that with the fact that the 540 line needs to be lower (and probably would be had it phased sooner), and you can start to see some of the things that can go wrong with this system. In this frame we still have good ridging out west which does help to slow things down, but it's the timing that is currently off. 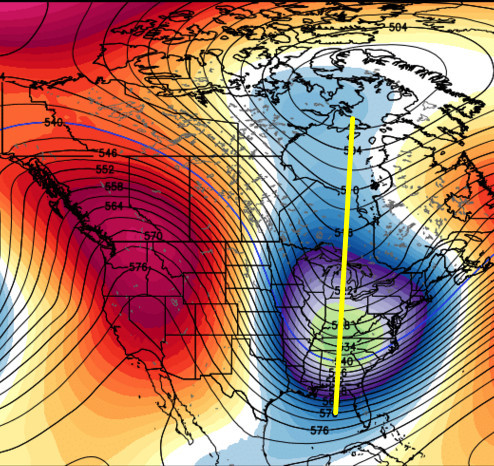 As you can see, everything on a big scale has to fall into place before the details can be determined, and it's never easy for us. This system will continue to evolve with every model run, we just have to hope it evolves in the direction that is favorable for us. There is still time for this to workout for us, but it needs to start shaping up pretty soon if it's going to happen. We are about 8 days away from this system, so not a lot of time to make corrections. Side note from Joe Bastardi...Before you leave here, I wanted to include Joe's thoughts about how he sees the remainder of winter unfolding, thoughts that he posted just a few minutes ago... The ridge coming back into western Canada was key to what cold there was in January. It is key to what cold there will be in February, too. The current warmup is around 10 days and the coming colder period 10-15 days. The following warmth will be another 10 days.  Current tropical convection in the MJO regions. Notice the enhanced convection around areas 3-4 (see region map below) Current tropical convection in the MJO regions. Notice the enhanced convection around areas 3-4 (see region map below) There have been grumblings about the "fly in the ointment"... the MJO. For those that don't know, the MJO stands for the "Madden-Julian Oscillation", an intraseasonal oscillation that is observed mainly over the Indian Ocean and Pacific Ocean, and has a major influence on our weather here. The MJO influences on the weather in Georgia, depend on the time of the season and the phase of the MJO. What might be a favorable phase in February, might be a terrible phase in June. So it's important to understand what the specific influences are for any given time period. First... lets take a look at the graph below of the MJO. This particular graph is from the GFS just because it's free and easy to pick on . :-) You see all 8 phases outlined on the graph as well as the general location of the MJO signal. It's important to note that the MJO is a traveling pattern, moving eastward at approximately 4 to 8 m/s through the atmosphere. So you can see this graph started on the 22nd of December (purple START) and each dot is a day. It's just like connect the dots... just follow the line around and through the different phases into January and then into February. You can see that the GFS takes the MJO into what is known as the COD or "Circle of Death", and I guess the COD deserves some little bit of explanation. As you go further to the outside of the graph, the amplitude or the strength of the MJO increases, as you go inside the COD, the MJO signal is barely discernible about the noise. This is important to note as you'll see later. You can find many of these images and much more, by clicking here for my MJO page.  So now that you see how the graph works, let's look at the different phases of the MJO and see exactly what that means and how they can influence our weather. MJO Phase This map shows the general phase location of the MJO signal. This map shows the general phase location of the MJO signal. When the MJO is in a particular phase, it means that anomalous precipitation and convection is taking place in that phase, that can also be strong or weak. The image on the left gives you a general idea where this area of enhanced convection is occurring. Now, take a look at the graphs below. These images are for Jan-Feb-Mar, and remember, the influence the phase has on our weather varies by month. The temperature anomalies are the two left columns, and the two right columns show the probability of the left side happening. So as you can see, for our neck of the woods in February, we would want to see the MJO in Phase 1, 2, 3, and 8, as those are the phases that are favorable for cold weather this month. 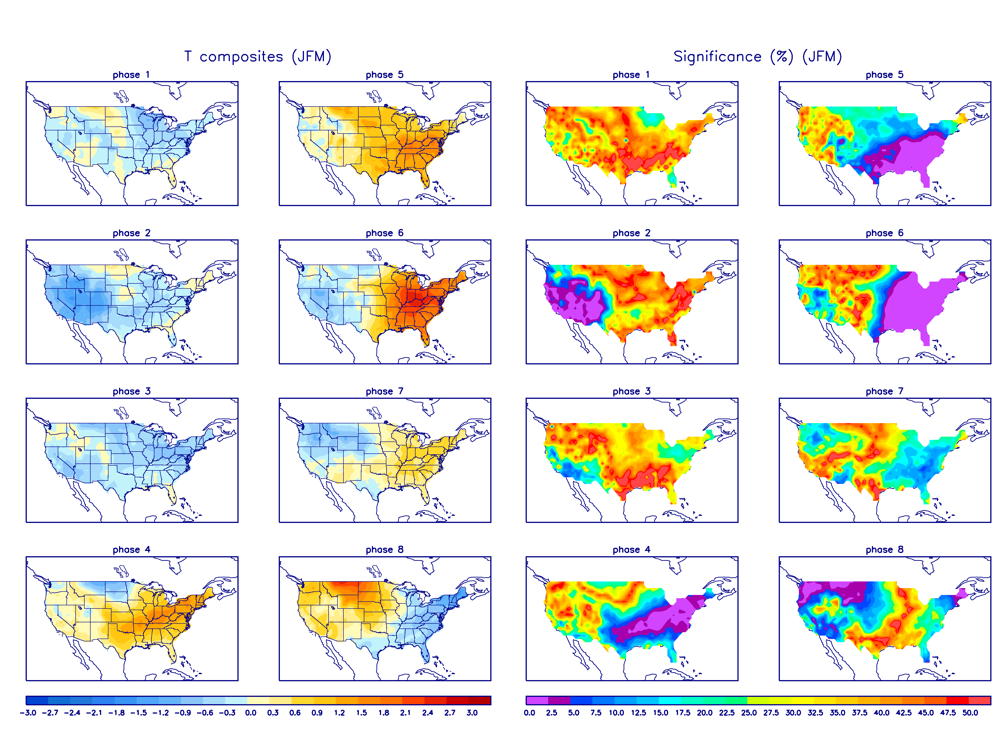 The MJO doesn't just affect temperatures either, here's a chart showing like the one above, but showing precipitation anomalies, and you can see that some phases are more favorable for precip than others.
So, what does all of this mean for us and why is the MJO the fly in the ointment? As you know, it's tough to get winter weather in Georgia outside of the mountains, we need to get everything lined up just right for snow. The fly in the ointment is that the MJO may end up in a phase that is fighting against the cold air trying to push south. Bastardi has had this as a nagging fear. You can see from the MJO forecast graphs below, all the models have a different idea about the progression of the MJO. There is one thing important for us though, even if the signal goes into the COD, that is not bad for us here in Georgia, as a matter of fact, some of our best winter weather events have occurred when the MJO was in the COD. bot there is one ominus note to that stat, all six of Atlanta's major freezing rain events have been when the MJO was in the COD. Be careful what you wish for.... So for us here, as long as we either stay in the correct phase or we see a very weak phase for those that are not favorable for us (or in the COD), the MJO should not be the major player that some have alluded to. However, if it decides to do as the Euro shows with a medium strong signal that rotates through 4,5,6,7, and 8 phases, then we may have some issues to deal with. We shall see. |
Archives
March 2019
Categories
All
|
OLD NORTH GA WX BLOG

 RSS Feed
|
Never base important decisions on this or any weather information obtained from the Internet. Always have a backup method of receiving weather information such as a battery powered weather radio.
Copyright © 2018 NorthGeorgiaWX.com and DaculaWeather.com 
|