|
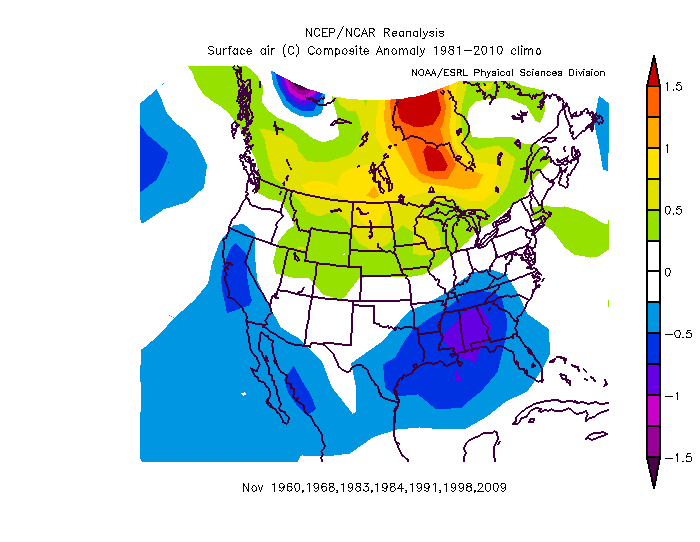
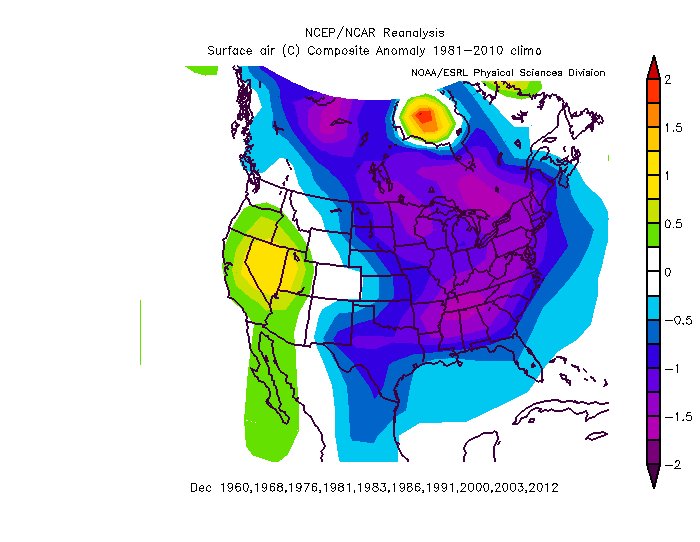
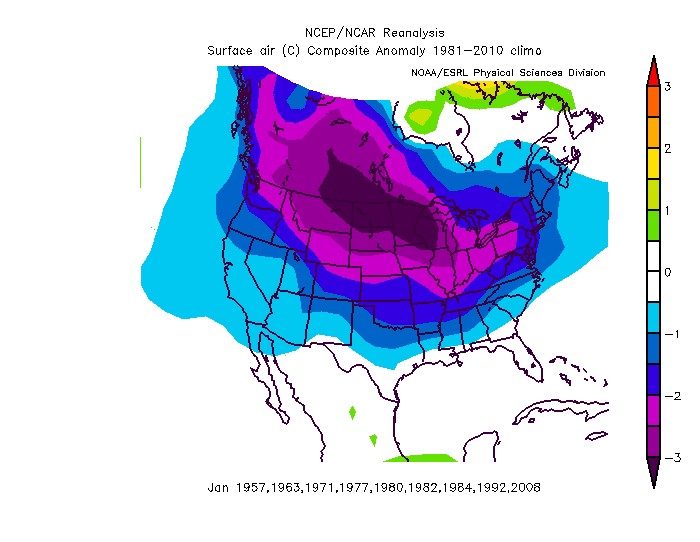
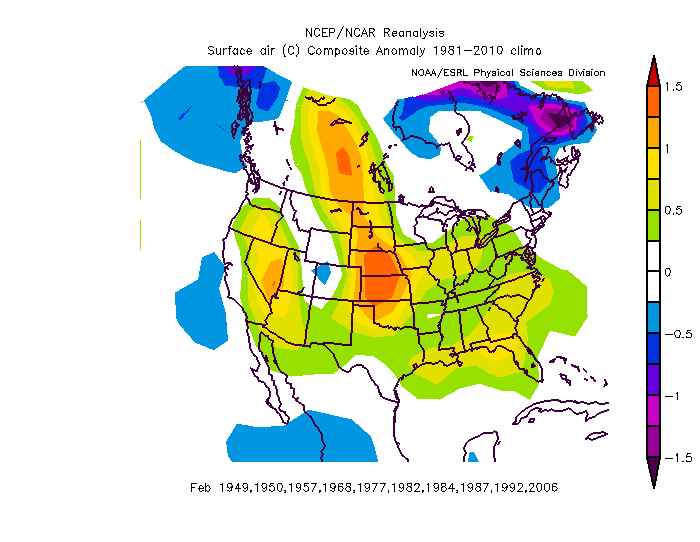
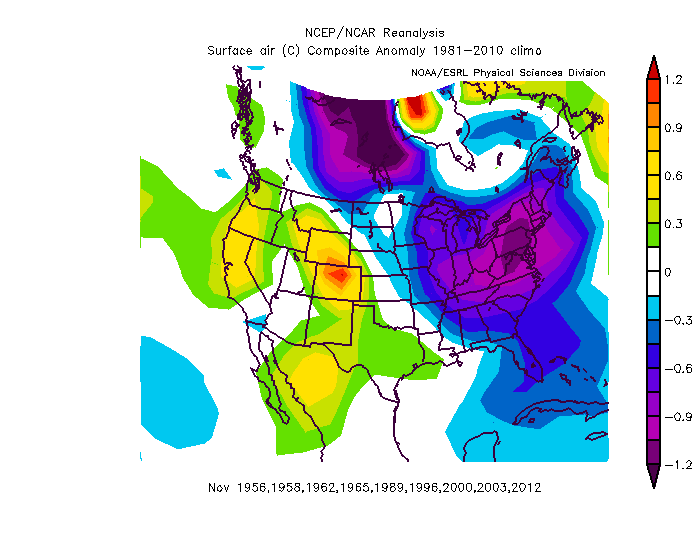
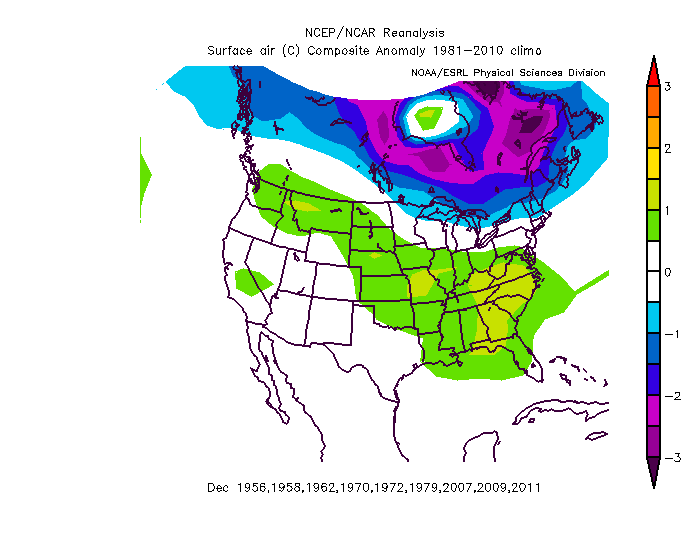
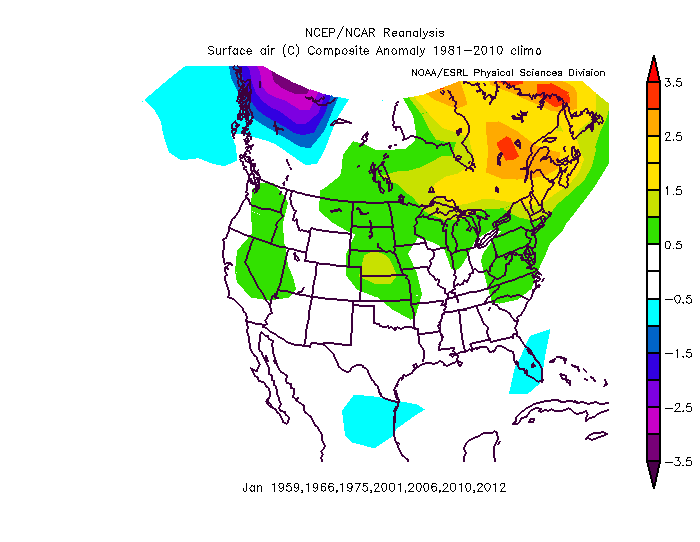
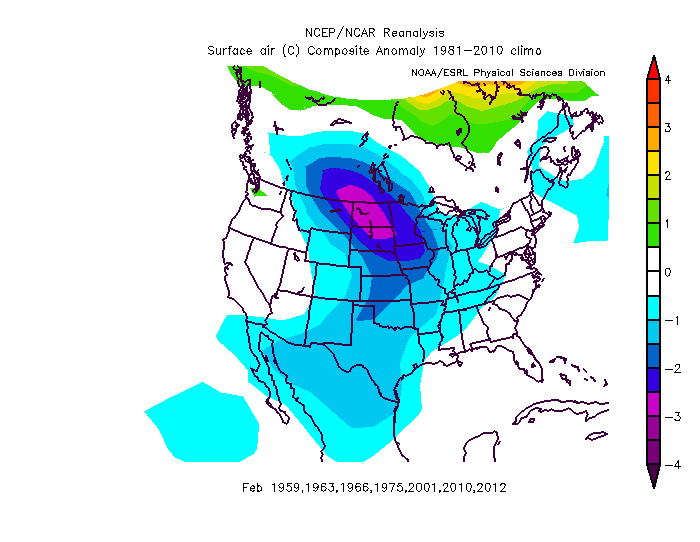
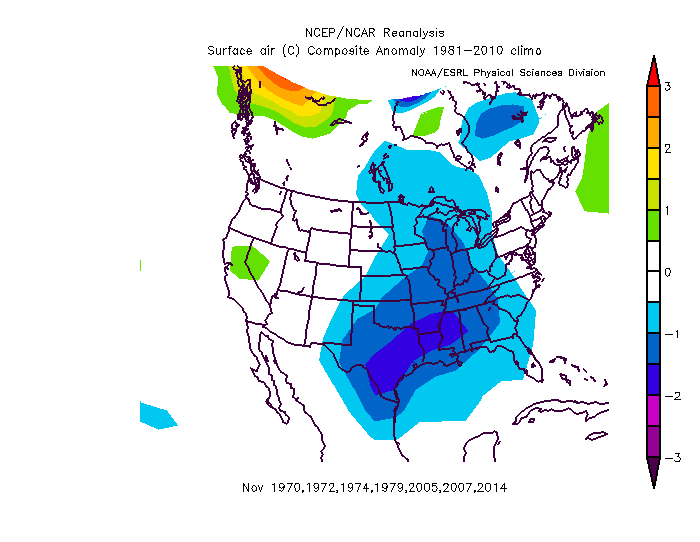
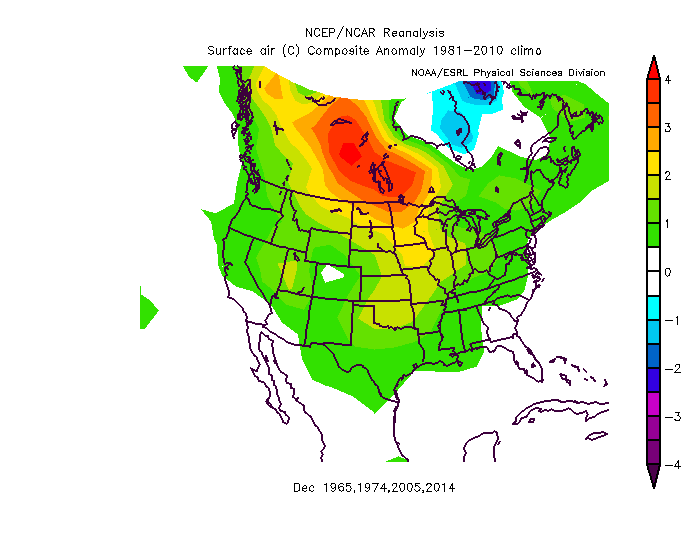
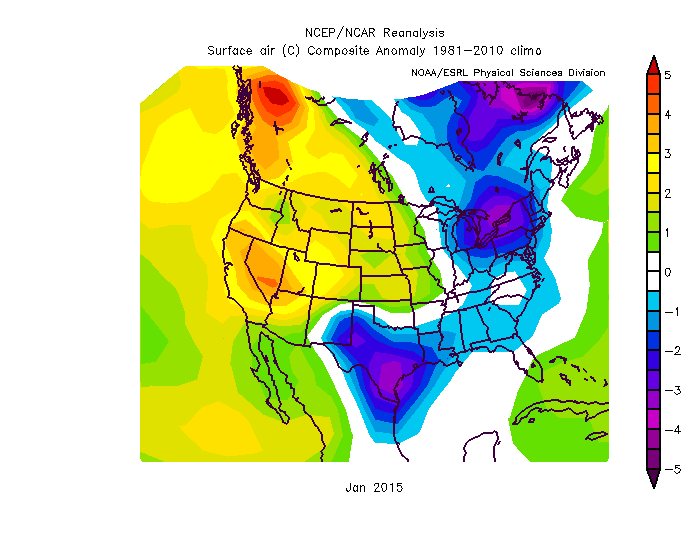
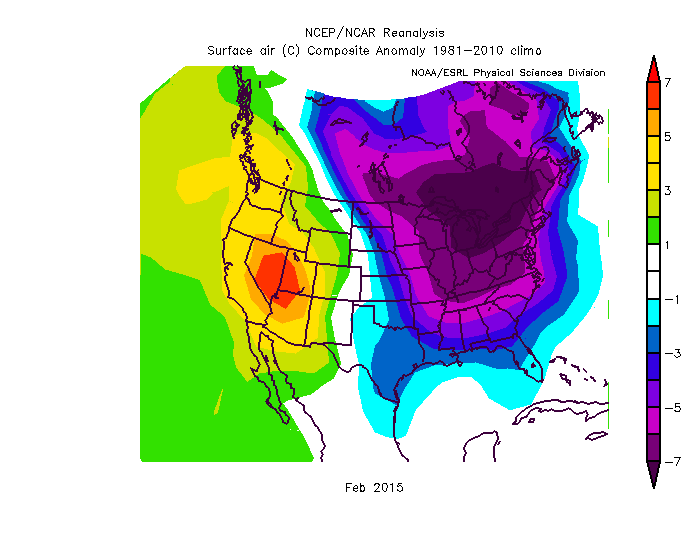
Ok... I went back and ran some analogs using years with an Easterly (negative) QBO and the results ( to me) were a little surprising. I broke this down by month from November through February, and I broke each month down to three categories with a QBO index range of -10 to -15, -15 to -20, and greater than -20. Without factoring in any other teleconnection patterns or ENSO state, these are the results. Keep in mind that the QBO records only go back to 1950, so we only have 67 years of data to work with which is a very limited data set. The years used are on each image and you can see all of the QBO values back to 1950 here. What is surprising is that in addition to the strength of the QBO, the QBO effects seem to vary depending on the month, much like the effects of other teleconnections or the MJO. For example with the MJO, the different Phases have different effects depending on the season. But based "strictly" on these numbers, November should be relatively cold if the QBO is between -10 and -15. Based on the last update to the index in September of this year, it was sitting at -15.28 and on a downward trajectory. (http://www.daculaweather.com/4_qbo_index.php). We are still waiting on the October index numbers and those should be out soon, but if the trend continues for November, it appears that all values of a -QBO indicate that our temperatures may end up colder than normal. December seems to do well with low negative QBO numbers and as the easterlies strengthen, the cold changes to warmth. Obviously a strong -QBO in December is NOT what we want. January seems to like weak negatives and really brings the cold when that happens. But make it stronger and it becomes warmer... unless it's really strong and the cold returns. February begins the trend the other way with a weak -QBO showing warmth, but as you move toward a stronger QBO it gets very cold. |
Archives
March 2019
Categories
All
|
OLD NORTH GA WX BLOG
 RSS Feed
