|
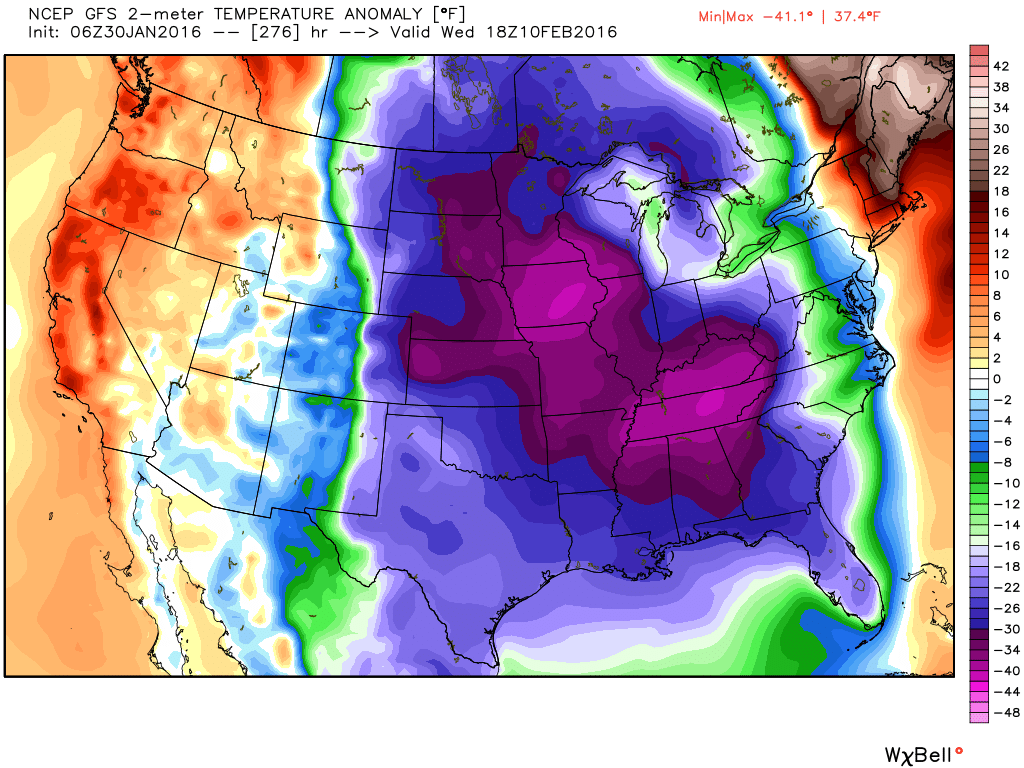
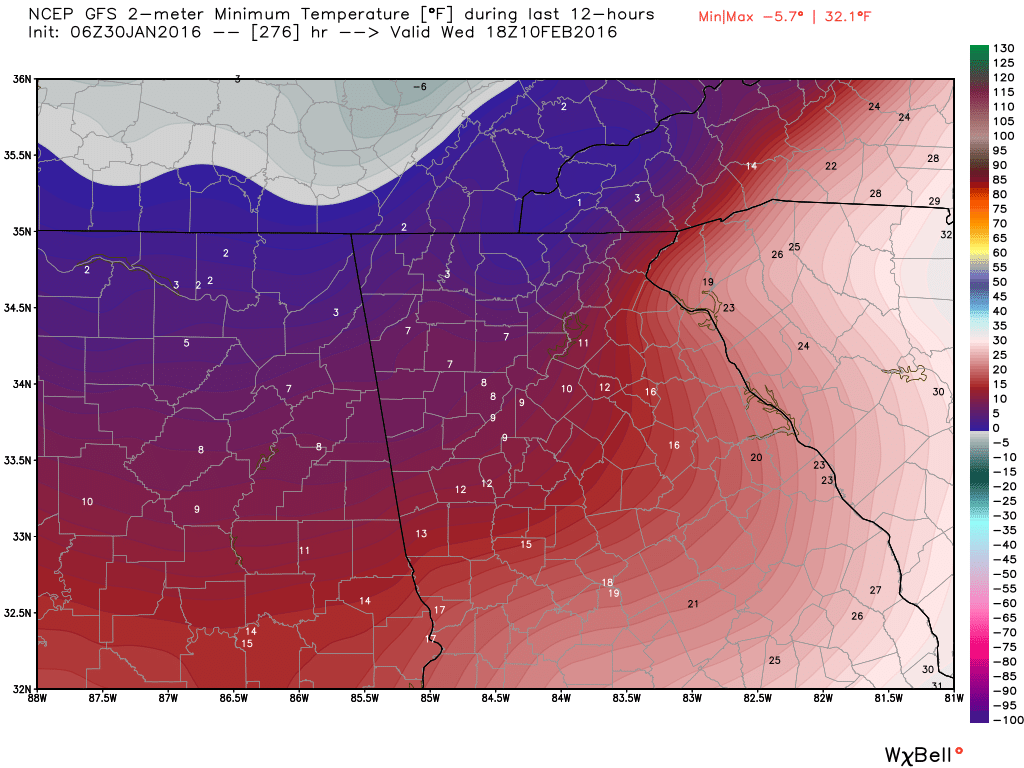
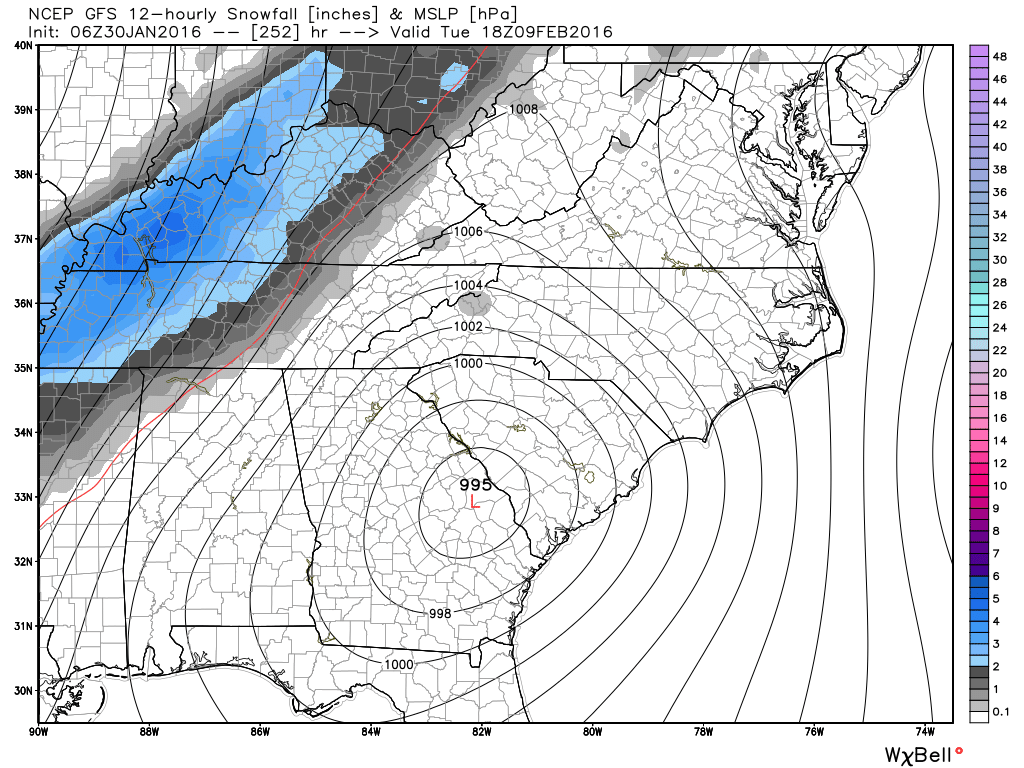
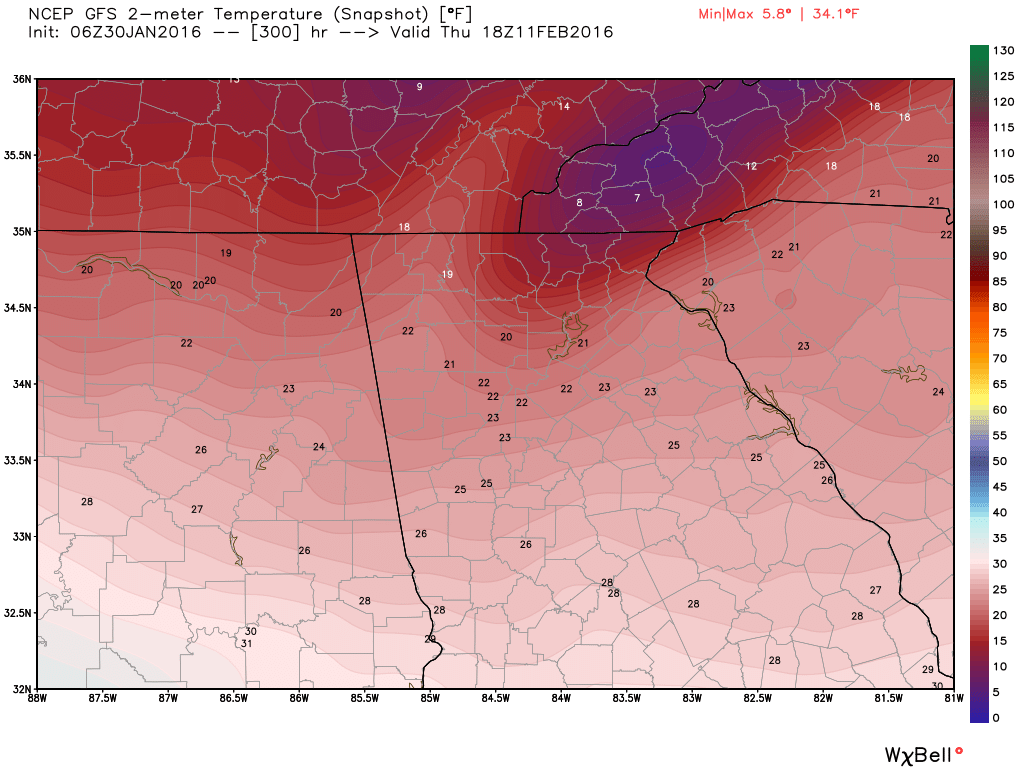
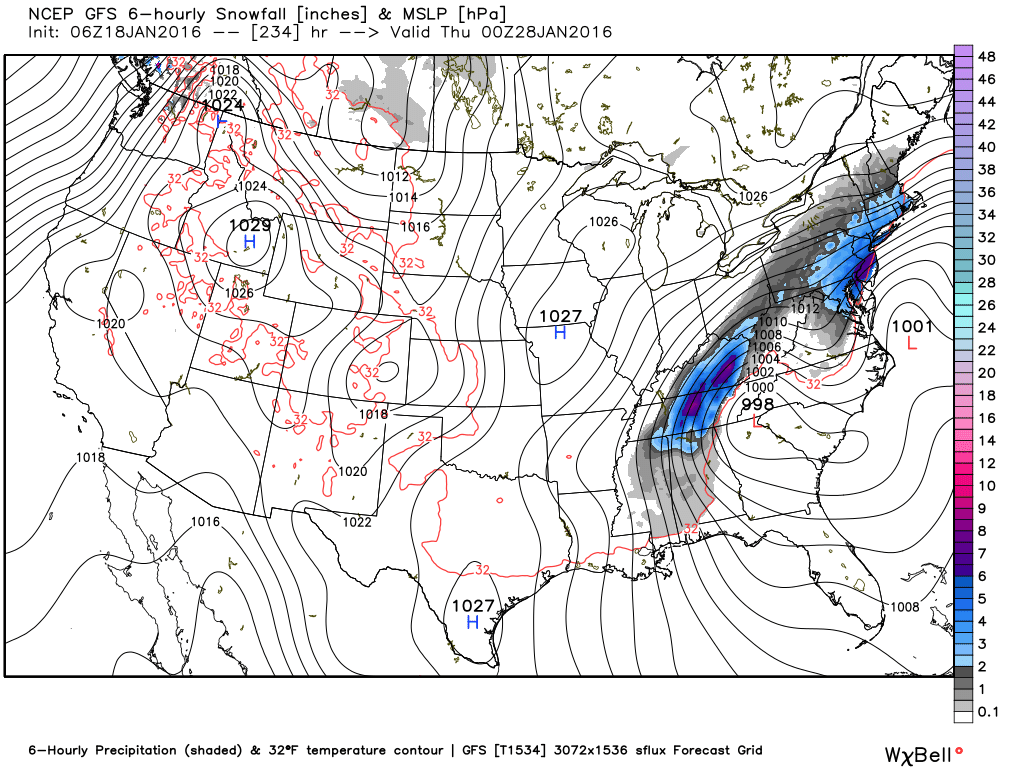
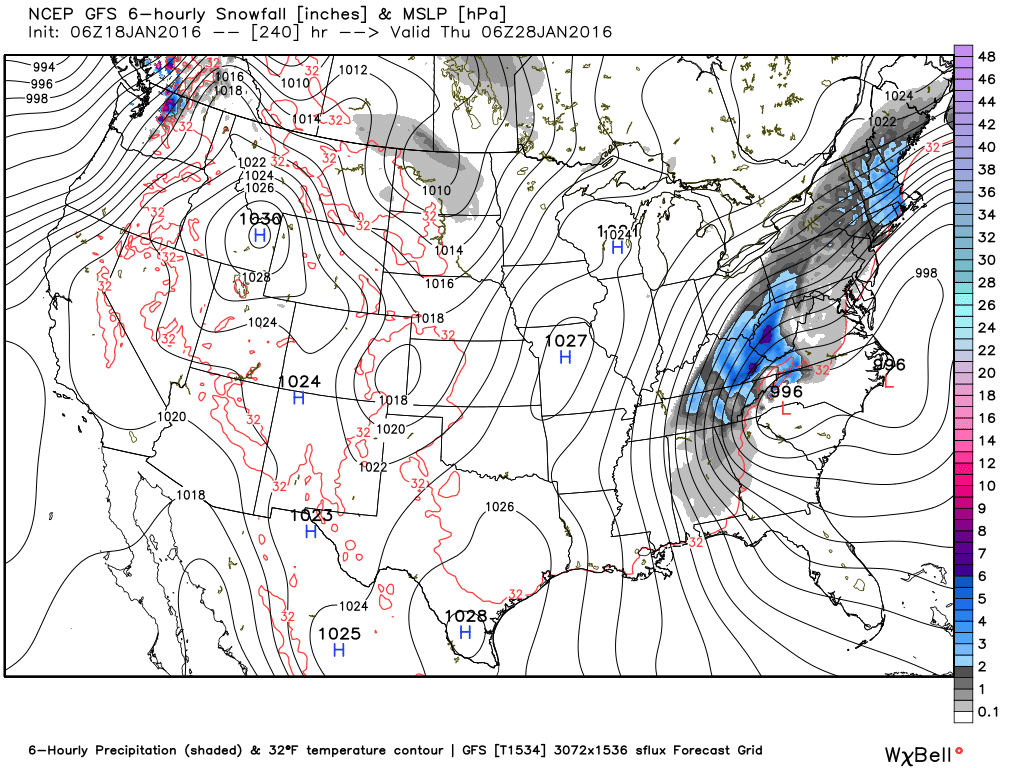
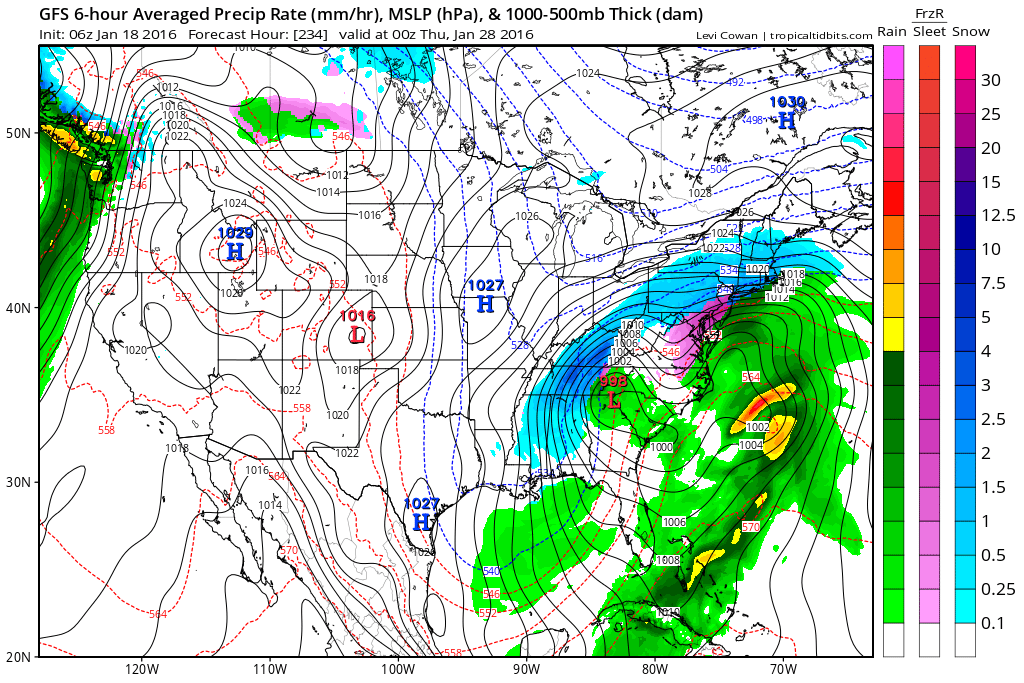
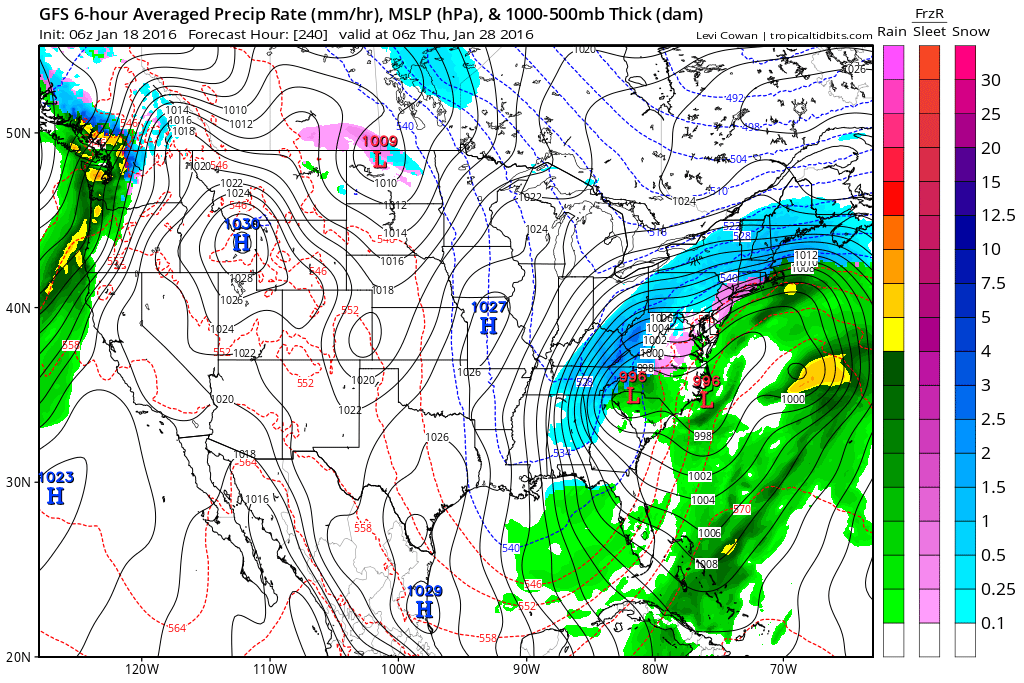
I started looking at the computer models this morning, and I usually look at the GFS first since it appears first in the list of modes on the WeatherBELL site. I got out to around day 10-11 and and my jaw hit the floor. The GFS was bringing the whole arctic into the US. The images are explained below, but what the GFS is showing are temperatures 40-50 degrees below normal. Lows in north Georgia would be in the single digits if not lower, and highs would struggle to get above 20. But.... there is a possibility of a big storm during that period. THIS is the storm and period we can't afford to miss out on, so we'll wait and see if the low takes a more southern track. There is a lot of time for this pattern to evolve but it appears to be a prime period for winter weather. Just a reminder that these images are not a forecast, but one model run from one model. But we are certainly headed the correct direction for winter weather.
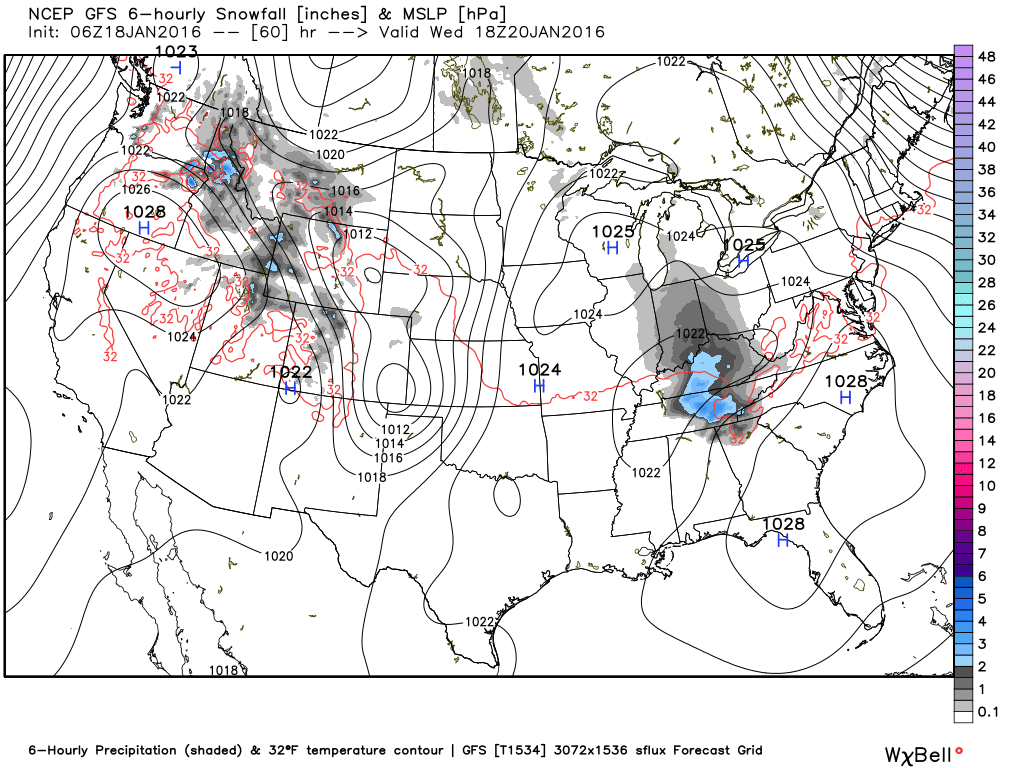
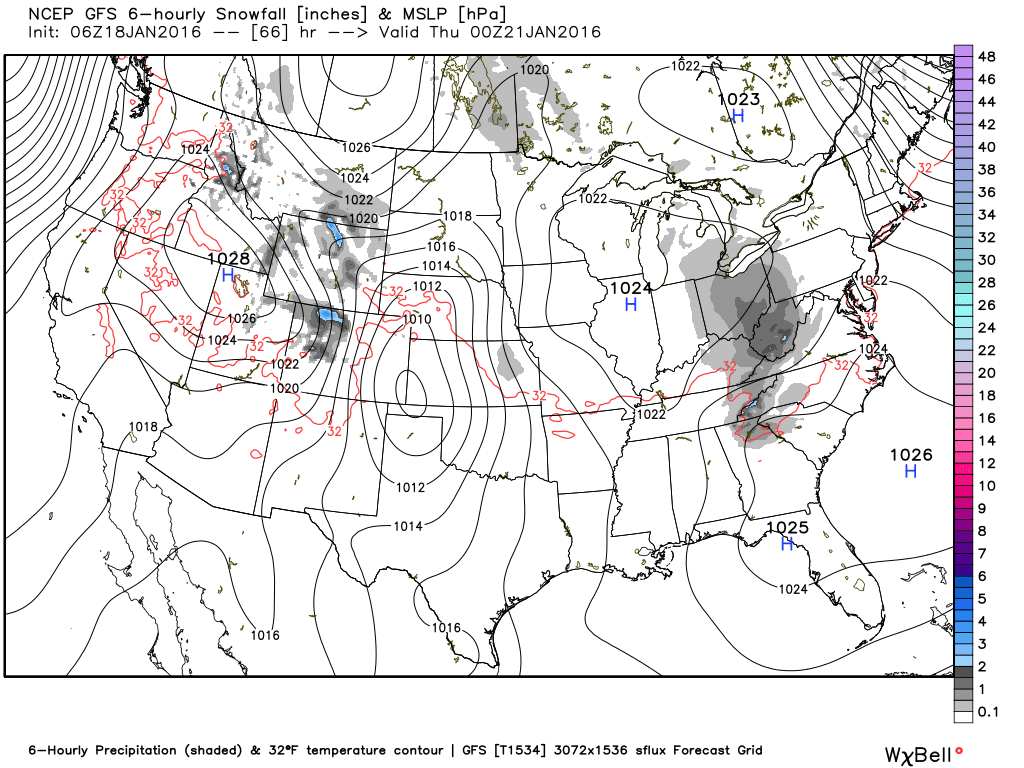
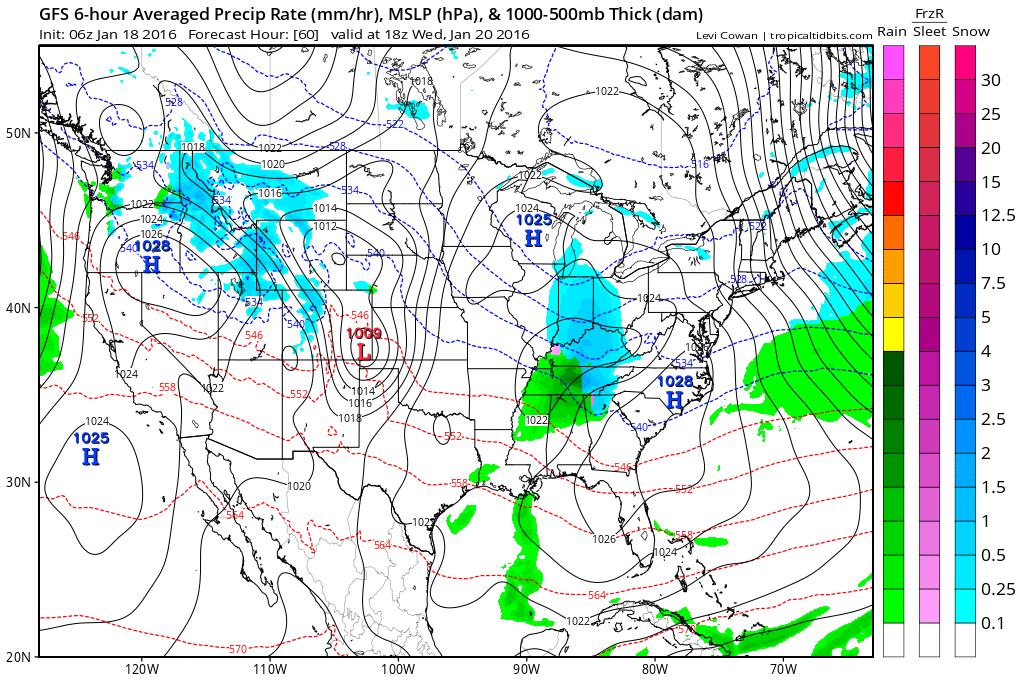
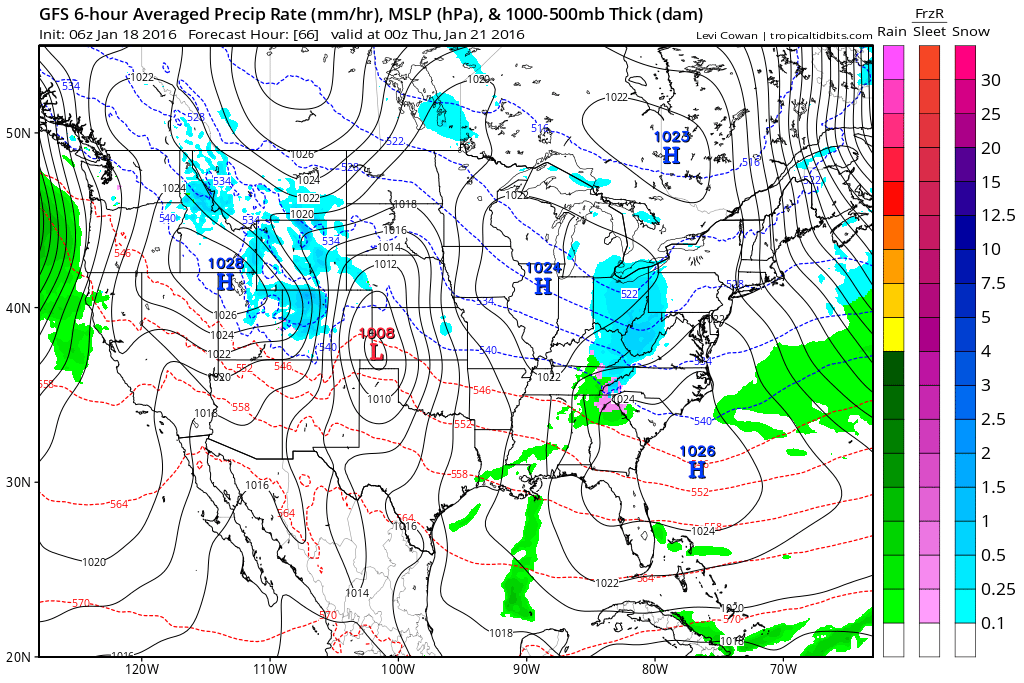
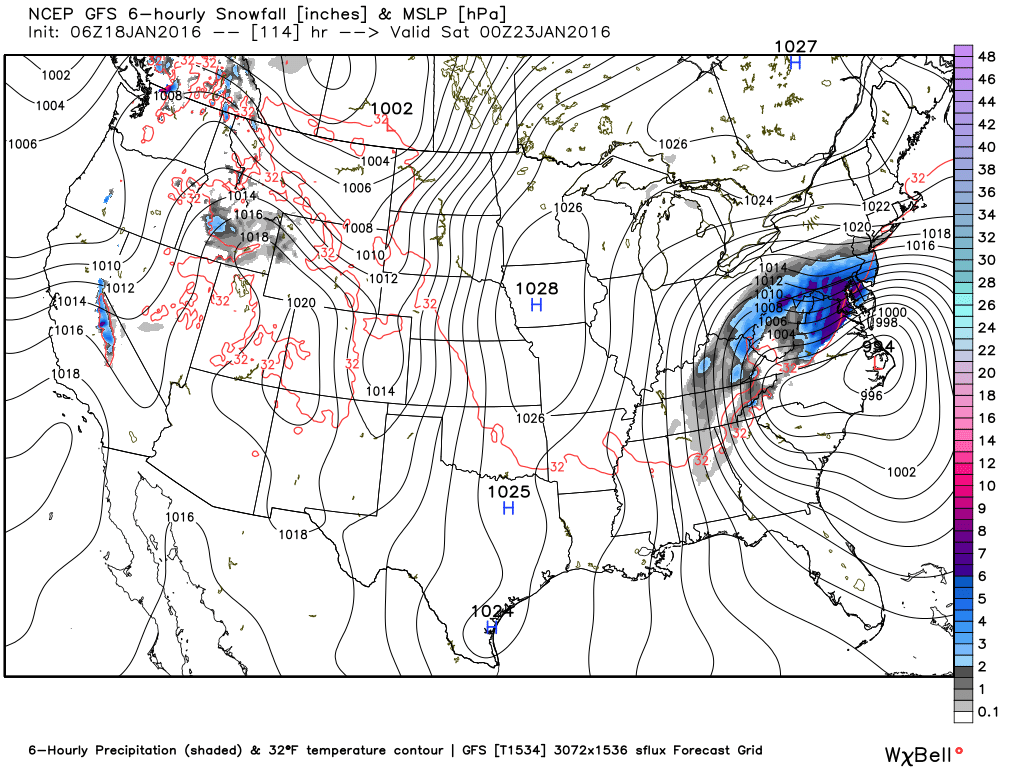
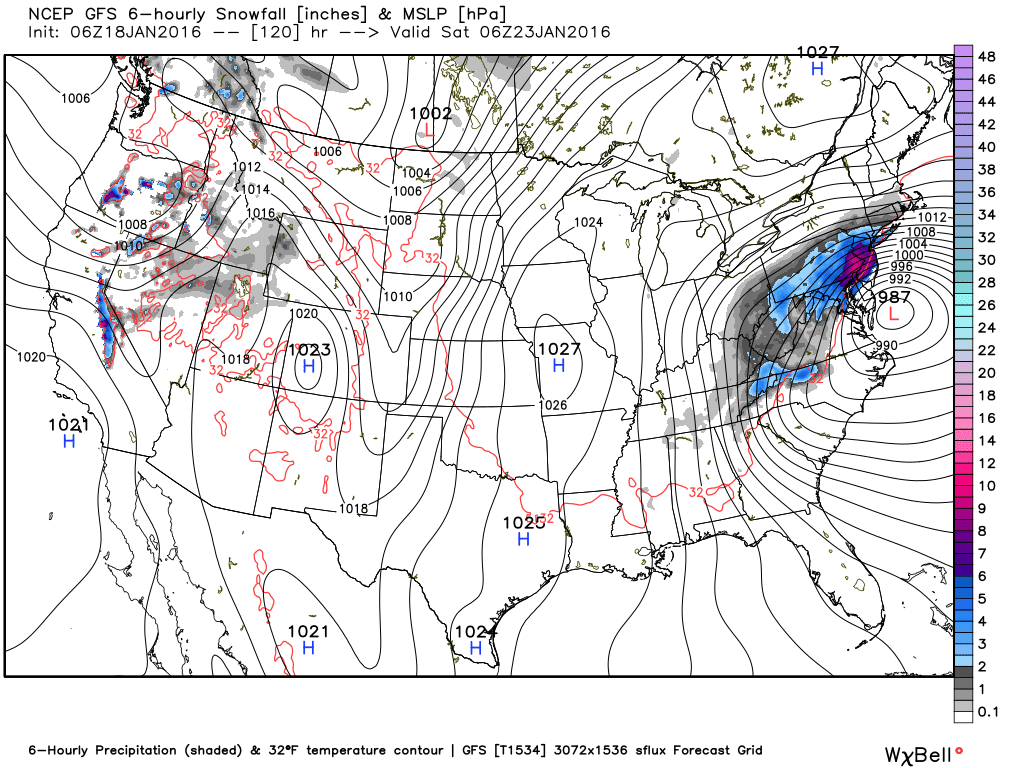
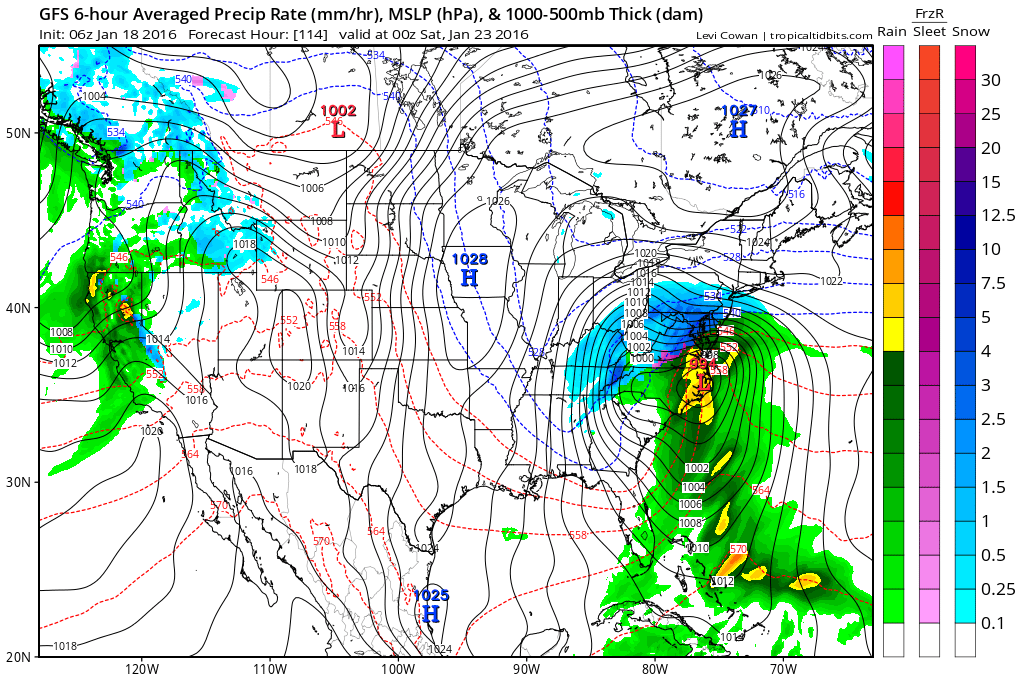
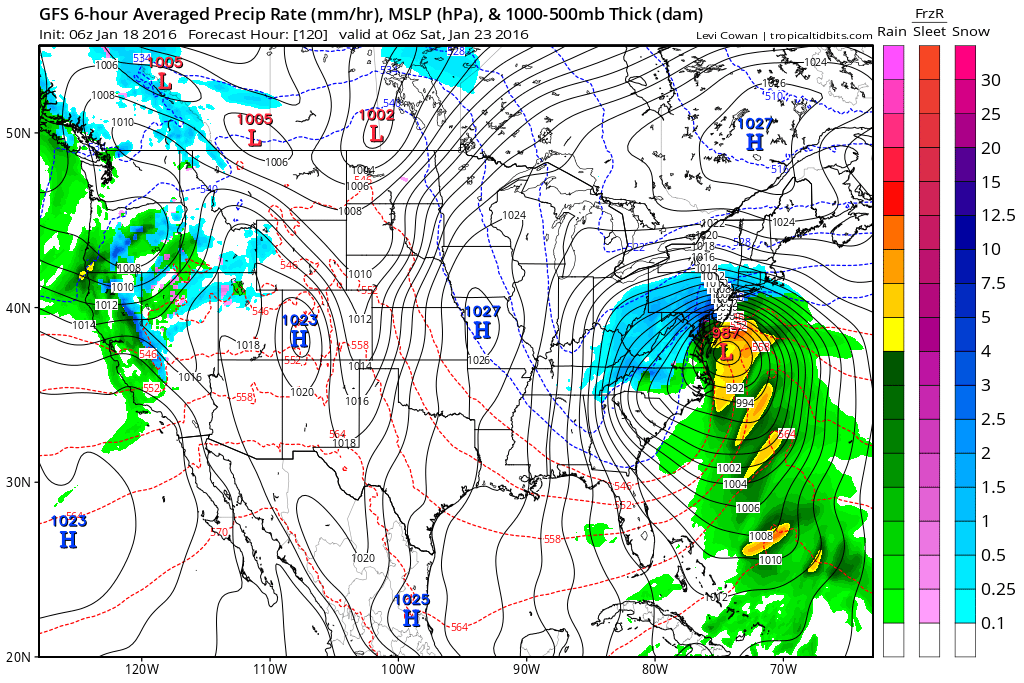
**** SNOW WISHCAST **** OK...I'm going to do something I don't like to do, but just so no one gets too discouraged after reading my message this morning... THIS IS NOT A FORECAST, THIS MAY NOT HAPPEN AT ALL, AND IT WILL MOST LIKELY NOT HAPPEN LIKE YOU SEE IT HERE. Do not go tell people I said it was going to do what these maps say. Do we have a deal? :-) This is the GFS on Wednesday. They simply show we're close. The image on the right shows some potential for icing as the moisture departs, although temps should rise above freezing. The next set of images are for Friday. you can see that our only hope in this scenario is that we get some wrap around moisture. This look is not usually good for us. This system on the 28th is a big dog storm. Granted, for us at the moment these maps were produced, the low is too close, we would only get wrap around snow, but this is very much something to keep our eye on. And notice something else, notice how the track is further south than the system that we will see this Friday. As we go into February, those tracks should get even lower, and that's when we start to get excited. We get that track a little bit lower for this system and we might be looking at our first real winter storm. Drop that track down just a little further than that and it might just end up being a big winter storm.
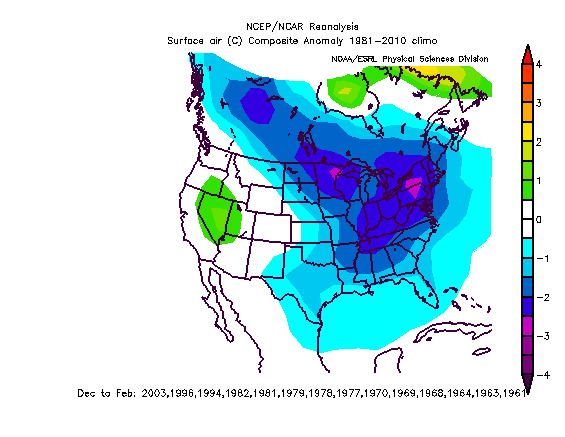
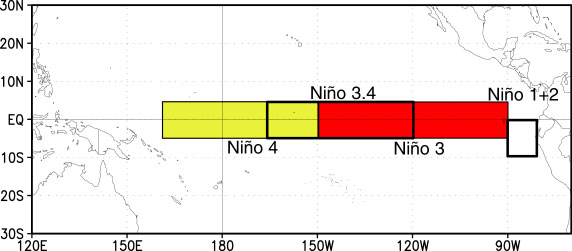
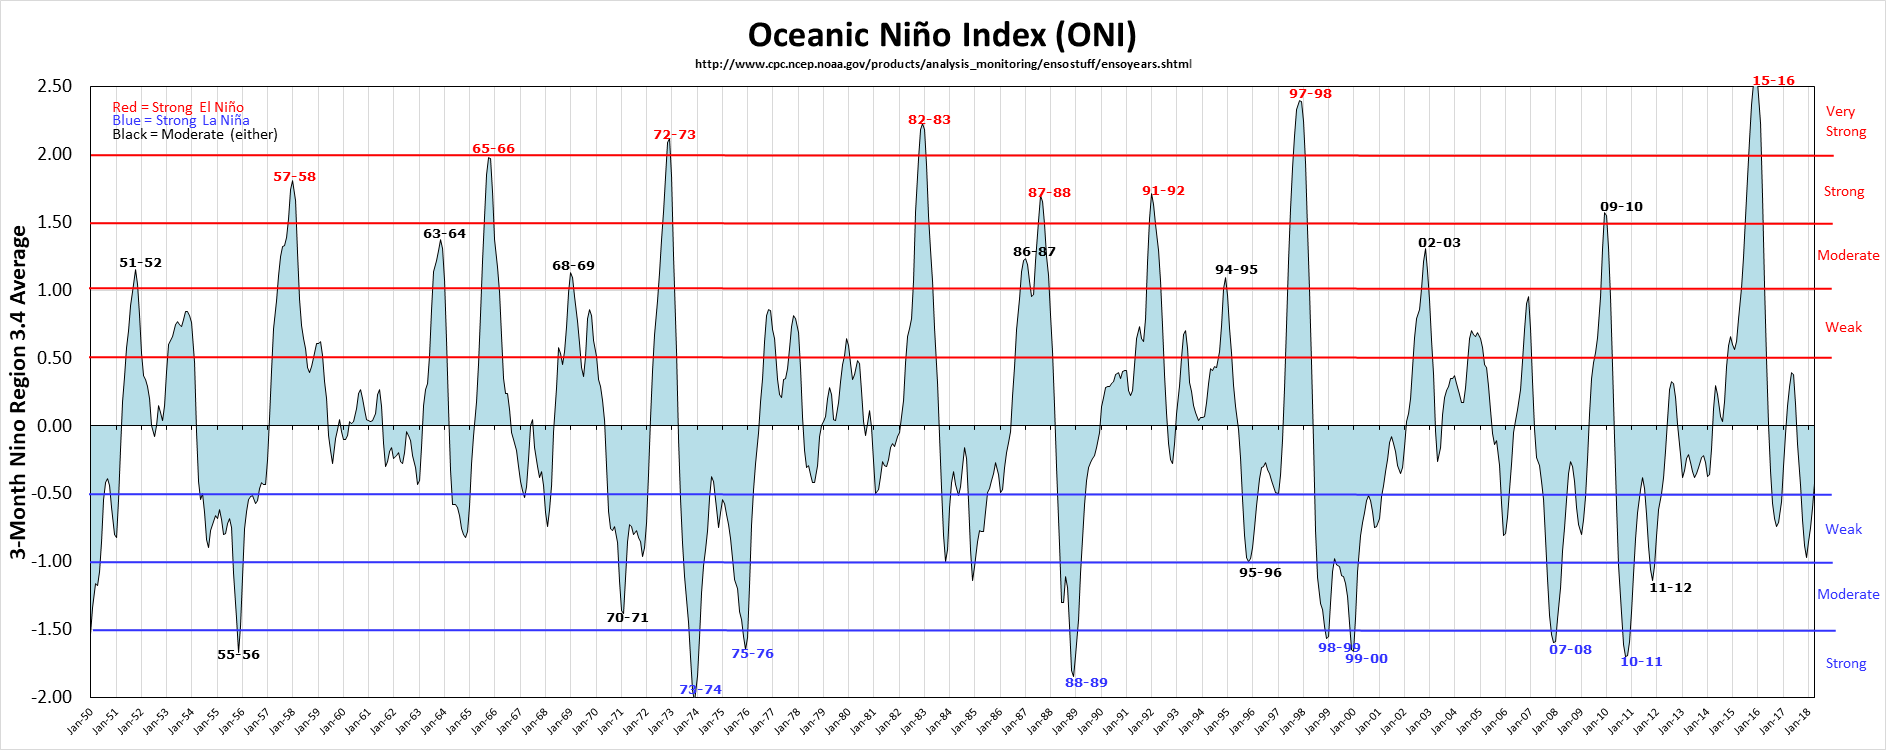
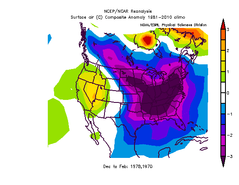
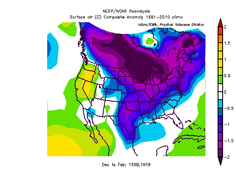
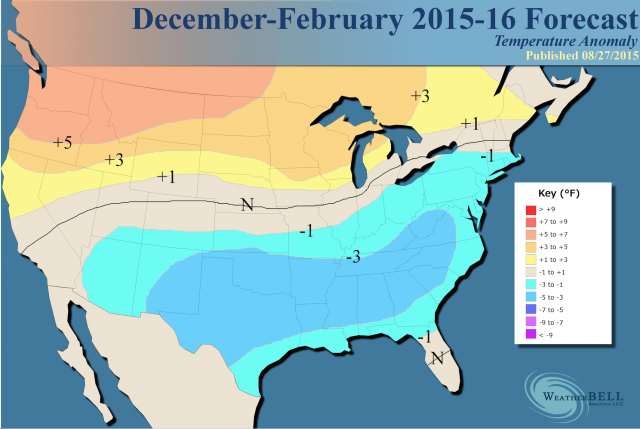
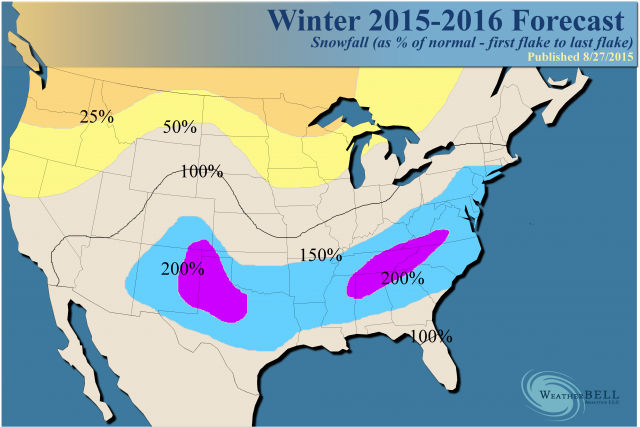
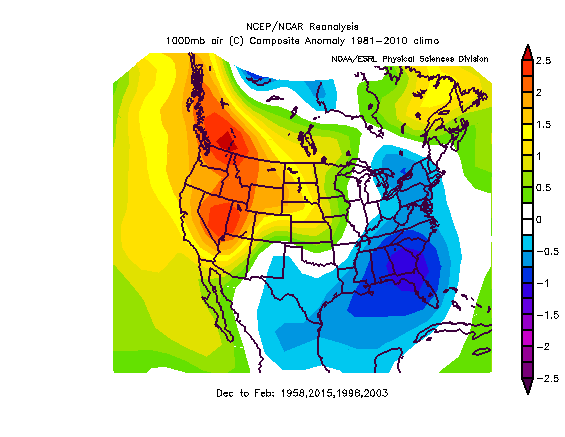
This is 10 days out, so I don't want to give any false hope to anyone, but we are heading into the prime time of our winter season, so there is certainly lots of reason to have hope. Images WeatherBELL and Tropicaltidbits  Now that meteorological fall is upon us, it's time to take a look at this winter and and what may be coming down the road for our Winter. On my NorthGeorgiaWeather Facebook page, I've already shown you Weatherbell's winter forecast (if you missed it, it's all the way at the bottom of this page) and what it means for the southeast US this winter, but I'd like to take a look at the southeast in particular, and see what if any tidbits we can discover that may enlighten us about the coming winter. The main focus on this article is not to make a winter forecast, but to explore what effects El Nino's and teleconnections have on winter weather across the southeast. One of the main sources of data in this report comes from a weather friend of mine that I call "Brother Larry". Larry would prefer to remain anonymous, so from here on out you'll hear me refer to Larry as "Brother Larry". :-) Larry has a wealth of information about the weather history in Georgia, and I'll be using a lot of his findings to help give you an idea how this winter may turn out, based on the environment created by the El Nino, as well as several other factors. Again, this data is based on analog years, or those years that most closely identify with the current patterns, so keep that in mind. Analog's are not perfect, but they do give us a very good idea about how things have happened in the past and how they may happen again in the future. Again, almost all of the text below (other than a few of my own edits and additions) is from Larry, and he gets all the credit for the research and stats. Nino's and Southeast US WintersThis data was compiled by taking a list of 26 “cold” US winters (Dec/Jan/Feb) since 1894 -1895 (i.e., the coldest 23%) for the eastern third of the US. This requires solid, widespread, below normal anomalies, and requires the southeast to be pretty chilly itself. The two maps to the right were created with data from the list of years below, but that dataset only goes back to 1948, so the maps I'm displaying are not 100% complete with the years in the list. Here's the list of those winters, and you can see the years I used on the maps themselves. Also, Larry's 26 coldest winters study was done the better part of 10 years back, since then, it is possible that some of 09, 10, 13, 14, etc. could be added, although he is not reassessing those now.
Nino Base State
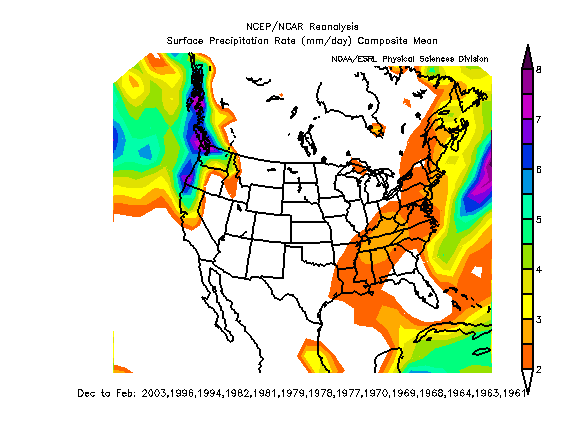
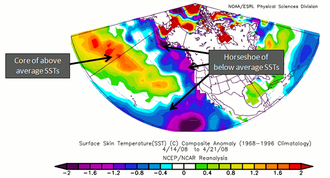
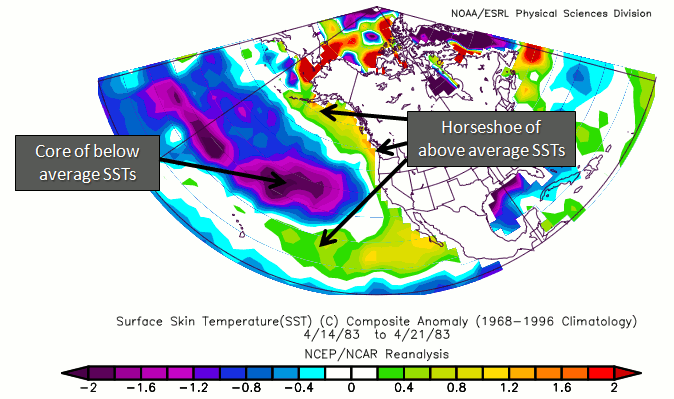
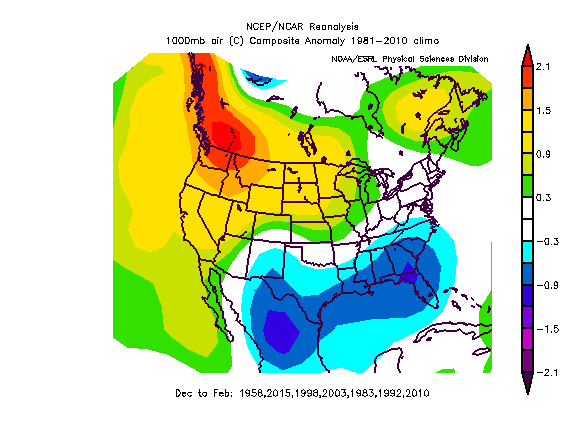
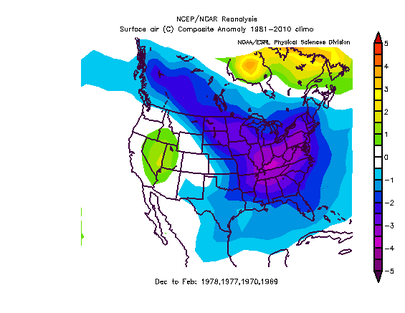 Dec-Feb temperature anomalies during weak Nino's. Dec-Feb temperature anomalies during weak Nino's. Notice that out of all the cold years, the majority of them occurred during weak Nino's (35%). Also notice that out of all of those cold winters, none of them occurred with a strong Nino or a strong Nina. The map on the left depicts the temperature anomalies that occurred during a Weak Nino. Due to the data only going back to 1948, all of the years are not depicted, but this will give you a good idea. As you can see, a weak Nino is what we'd like to see come Dec-Feb. If the current one stays too strong, it could severely limit our cold this winter based on past analogs. keep in mind, Larry's study is based on temperatures, not precipitation. Nino and the Pacific Decadal Oscillation (PDO)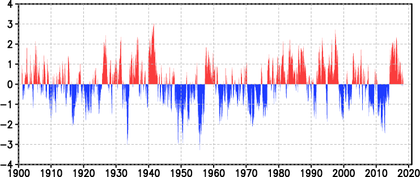 PDO over time PDO over time While it's easy to look at one specific weather pattern, there are many factors that determine how a winter will turn out, with the ENSO state being just one of those. But there are other teleconnections and long term patterns that also have an effect on our winter weather, and they all work in tandem with each other. Graphs and Charts Now we are going to turn our attention to the PDO state or Pacific Decadal Oscillation. First, the definition from the National Center for Environmental Information: "The Pacific Decadal Oscillation (PDO) is often described as a long-lived El Niño-like pattern of Pacific climate variability (Zhang et al. 1997). As seen with the better-known El Niño/Southern Oscillation (ENSO), extremes in the PDO pattern are marked by widespread variations in the Pacific Basin and the North American climate. In parallel with the ENSO phenomenon, the extreme phases of the PDO have been classified as being either warm or cool, as defined by ocean temperature anomalies in the northeast and tropical Pacific Ocean. When SSTs are anomalously cool in the interior North Pacific and warm along the Pacific Coast, and when sea level pressures are below average over the North Pacific, the PDO has a positive value. When the climate anomaly patterns are reversed, with warm SST anomalies in the interior and cool SST anomalies along the North American coast, or above average sea level pressures over the North Pacific, the PDO has a negative value (Courtesy of Mantua, 1999). " Here's an analysis of the cold 26 winters by DJF averaged PDO status:
Nino and the North Atlantic Oscillation (NAO)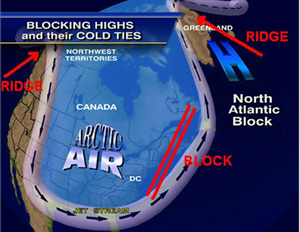 In order for us to get long lasting cold air that stays locked in, we need some blocking. There are several teleconnection patterns that aid in developing this blocking, one of which is the North Atlantic Oscillation or NAO. Graphs and Charts Here's the definition of the NAO: "The North Atlantic Oscillation (NAO) is a climatic phenomenon in the North Atlantic Ocean of fluctuations in the difference of atmospheric pressure at sea level between the Icelandic low and the Azores high. Through fluctuations in the strength of the Icelandic low and the Azores high, it controls the strength and direction of westerly winds and storm tracks across the North Atlantic. It is part of the Arctic Oscillation, and varies over time with no particular periodicity." Strong positive phases of the NAO tend to be associated with above-average temperatures in the eastern United States and across northern Europe and below-average temperatures in Greenland and oftentimes across southern Europe and the Middle East. They are also associated with above-average precipitation over northern Europe and Scandinavia in winter, and below-average precipitation over southern and central Europe. Opposite patterns of temperature and precipitation anomalies are typically observed during strong negative phases of the NAO. For us, negative is what we're looking for in the winter. Let's take a look at the analysis of the cold 26 Dec-Feb winters by averaged NAO status:
Nino and the Arctic Oscillation (AO)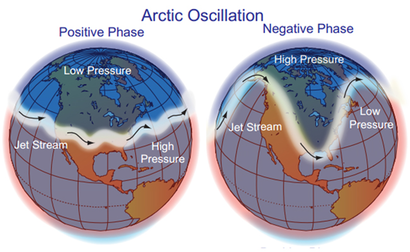 One teleconnection we haven't discussed is the Arctic Oscillation, and it very important in terms of forcing cold air south. Graphs and Charts The definition: "The Arctic Oscillation (AO) is a climate index of the state of the atmospheric circulation over the Arctic. It consists of a positive phase, featuring below average geopotential heights, which are also referred to as negative geopotential height anomalies , and a negative phase in which the opposite is true. In the negative phase, the polar low pressure system (also known as the polar vortex) over the Arctic is weaker, which results in weaker upper level winds (the westerlies). The result of the weaker westerlies is that cold, Arctic air is able to push farther south into the U.S., while the storm track also remains farther south. The opposite is true when the AO is positive: the polar circulation is stronger which forces cold air and storms to remain farther north. The Arctic Oscillation often shares phase with the North Atlantic Oscillation (NAO), and its phases directly correlate with the phases of the NAO concerning implications on weather across the U.S." A few tidbits regarding the AO/ENSO combo for DJF at Atlanta since 1950-1:
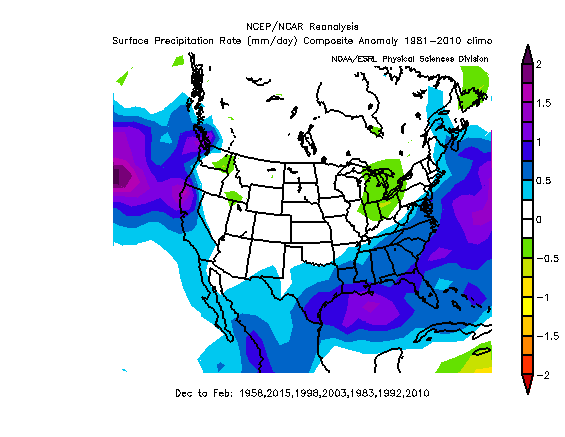
This all tells us is that the combo of El Nino AND a strong -AO is crucial for chances for a very cold Georgia (and much of the southeast US) winter. Because the correlation of November AO and DJF AO is strong and a lot stronger than the October AO is to DJF AO, it should be very interesting to see how November's AO ends up. So now that we've looked at several factors that help to determine how we do over the winter, let's piece all of this together to find out how this could affect our winter weather. Piecing it all together...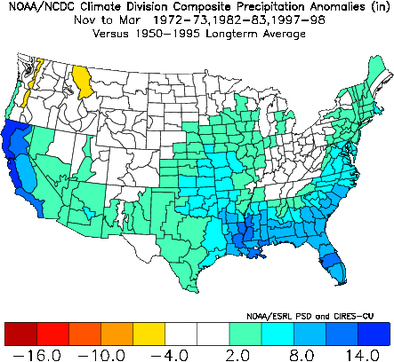 Precip Anomalies during strong Nino's Precip Anomalies during strong Nino's Now let's take the combination of the ENSO state (in our case, Nino), and factor in the PDO and NAO and let's see what we get. Here's the analysis of the 26 cold winters by a combination of Dec-Feb averaged PDO and NAO status:
Now, let's really lay it out. Here's "Brother Larry's" analysis of the 26 cold winters by a combination of ENSO state and Dec-Feb averaged PDO and NAO status: Strong Nino:
Moderate Nino:
Weak Nino:
Neutral Positive:
Neutral Negative:
Weak Nina:
Moderate Nina:
Strong Nina:
Conclusions...
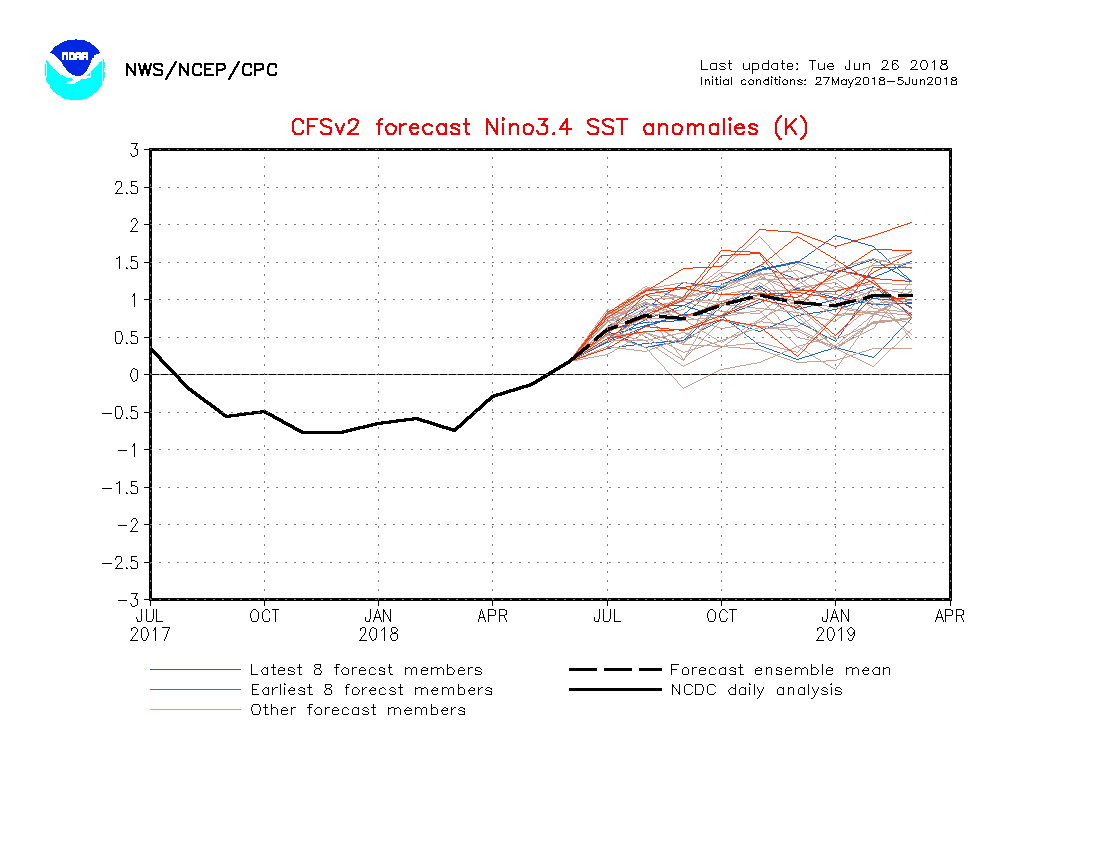
But wait... Let look at 2nd Year Nino'sPeriods with back to back El Nino's is not all that common, in fact, our last back to back El Nino was back in 1986-1988. Since we've been keeping records there have only been 12 back to back Nino's, and on average, they show up about every 11 years. As you can see that we've had a drought, since it's been almost 28 years since we've had a back to back Nino. Here are the list of 2nd year El Nino's and the relative temperature for that winter. The maps again only go back to 1948, so some years are left out.
2nd Year Nino Summary
But wait ... there's more!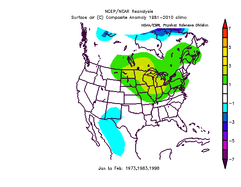 Jan-Feb 1973, 1983, 1998 Jan-Feb 1973, 1983, 1998 Whereas a very strong El Nino would very likely mean not nearly as cold of a winter as the last two for the eastern US as a whole, it's unlikely to be warm in the southeast US. Actually, it would much more likely be near normal based on 1877 -1888, 1972 - 1973, 1982 - 1983, and 1997 - 1998 though 1888 - 1889 actually suggests it could be another chilly one, especially because of February. (See image to the right) Regarding wintry precipitation for Atlanta, when looking at the three standalone super Nino's (1972 - 1973, 1982 - 1983, 1997 - 1998) as well as the six strong to super strong 2nd year Nino's (1877 - 1888, 1888 - 1889, 1896 - 1887, 1905 - 1906, 1940 - 1941, 1987 - 1988), Atlanta more often than not, had one major winter storm, but not always:
But we're not done! There's more, and this is about precipitation. "Here's why I've been saying that as counterintuitive as it sounds, +NAO's don't seem to reduce the chance for a significant to major SE US SN/IP during strong El Nino's: Let's look at Raleigh's 2"+ SN/IP for strong Nino's since 1950, when the NAO table I use starts: 1/7/1958: 3" NAO +0.607 2/15/1958: 3" NAO -0.213 1/25-6/1966: 9.6" NAO -1.230 1/7-8/1973: 6.5" NAO -1.126 2/10/1973: 4.5" NAO +0.718 2/6/1983: 2.6" NAO -0.576 3/24/1983: 7.3" NAO +0.062 1/7-8/1988: 7.4" NAO +0.583 1/19/1998: 2.0" NAO +0.397 So, there are 5 +NAO and 4 -NAO averaging at a quite neutral -0.10 and with a median of a quite neutral +0.06. Regarding DJFM NAO for the biggest strong Nino SN/IP winters: yes, 1965-6 averaged -NAO but 1972-3, 1982-3, and 1987-8 all averaged +NAO. Similar analyses for some other major SE cities would yield pretty similar results." Again, thanks to Brother Larry for allowing me to use all of his extensive knowledge and data in this post. Weatherbell 2015 - 2016 Winter ForecastOctober 11th Update from "Brother Larry"..."Well, we have our second year El Nino from my standpoint. I count last winter as a borderline/very weak Nino though the latest ONI just missed on a technicality. Whereas a very strong El Nino would very likely mean not nearly as cold a winter as the last two for the eastern US as a whole, it would be unlikely to be warm in the southeast US. Actually, there, it would much more likely be near normal based on 1877-78, 1972-73, 1982-83, and 1997-98 though 1888-99 actually suggests it could be another chilly one, especially due to February. Regarding wintry precipitation in Atlanta when looking at the three standalone super Nino's (1972-73, 1982-83, 1997-98) as well as the six strong to super strong 2nd year Nino's (1877-78, 1888-89, 1896-97, 1905-06, 1940-41, 1987-88), Atlanta more often than not, had one major winter storm:
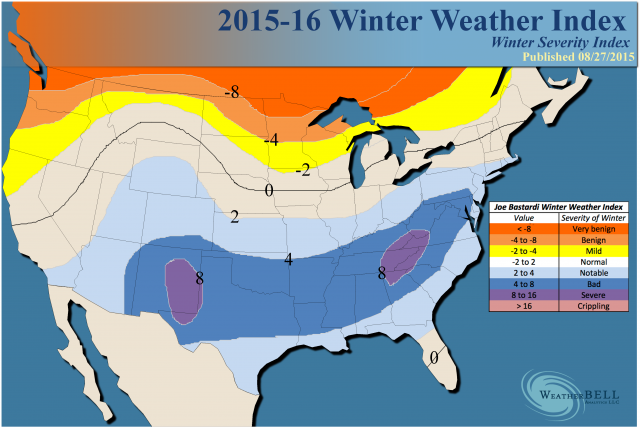
In summary: - 37" of S/IP for the these nine seasons in total or average of a whopping 4.1"/season, which is double the 2" normal, plus 1972-3 had a major ZR/1877-78 had a non-major ZR - A whopping 7 of the 9 had above average wintry precipitation and 6 of the 9 had a major winter storm (67%) vs. long term average of closer to only 40% - Whereas weak Nino's have been a good bit colder on average, at least Atlanta would still have quite favorable wintry precipitation climo this winter assuming a strong to super strong Nino. - So, my very early educated guess for the winter of 2015-6 for Atlanta, is for near normal DJF temperatures with one nice sized to major wintry precip event leading to them getting above average wintry precipitation for the season. Whereas 2014-5 busted at Atlanta for wintry precipitation vs my forecast, I'm still optimistic about 2015-6's chances per the above data." Update: I'm currently going 0 to -2 for DJF for temperatures for much of the SE US. I think that JB's -3 to -5 is likely going to end up too cold. I still think that there is a much higher than normal chance for above average wintry precip. in at least much of the well inland SE. I also think that places in and around the BHM-ATL-AHN-GSP-CLT-RDU corridor among other areas have a good shot/much higher than normal chance at a major winter storm. |
Archives
March 2019
Categories
All
|
OLD NORTH GA WX BLOG
 RSS Feed
