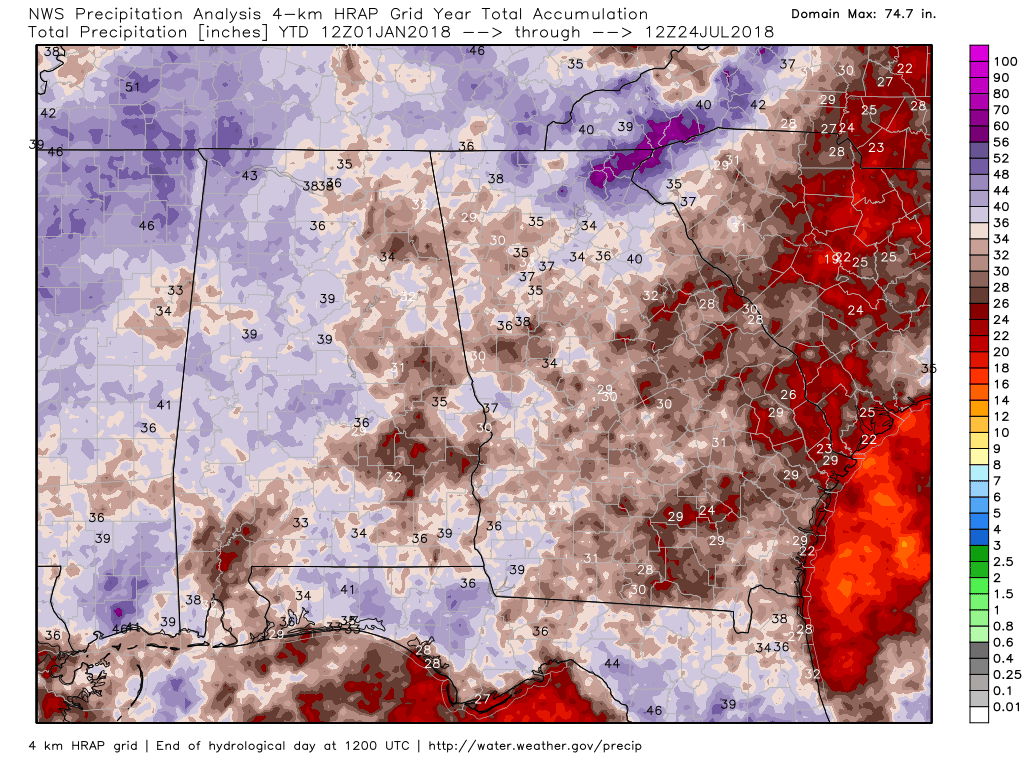
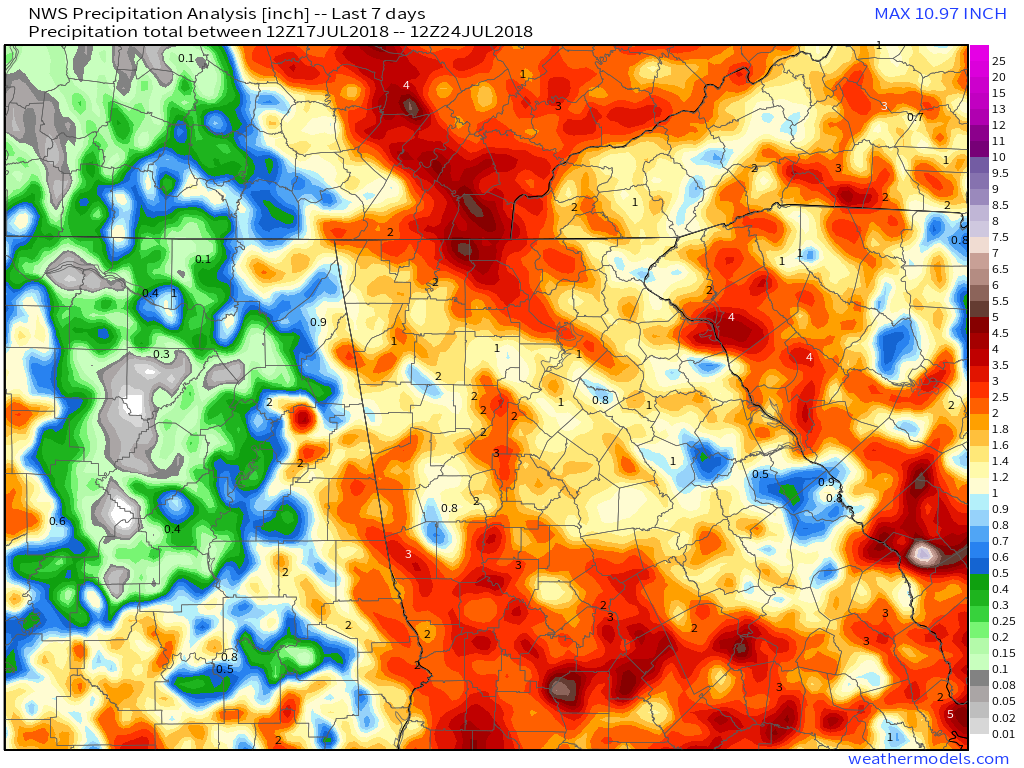
 Year to Date Rainfall Year to Date Rainfall We're almost through a full 7 months of this year, so I thought I'd take a look at the precipitation details for Georgia up to this point. I don't really like looking at specific locations for rainfall as the amounts can vary pretty widely across the area, so for the most part I'll show the state numbers, and then go back and show the data for the various climate locations for the Atlanta NWS forecast area. I've tried to keep it short and sweet and let the images and maps do the talking. In the rows where there are three images, the images from left to right are: Total Precipitation, Amount of Precipitation Above Normal, and the % of Normal Precipitation. The 7 day and 30 day charts include yesterday (up to 8:00 am July 24) in the calculations. Last 7 DaysThe last 7 days have seen some very heavy rain for some areas, and parts of north Georgia have seen up to 300% of their normal for this period.
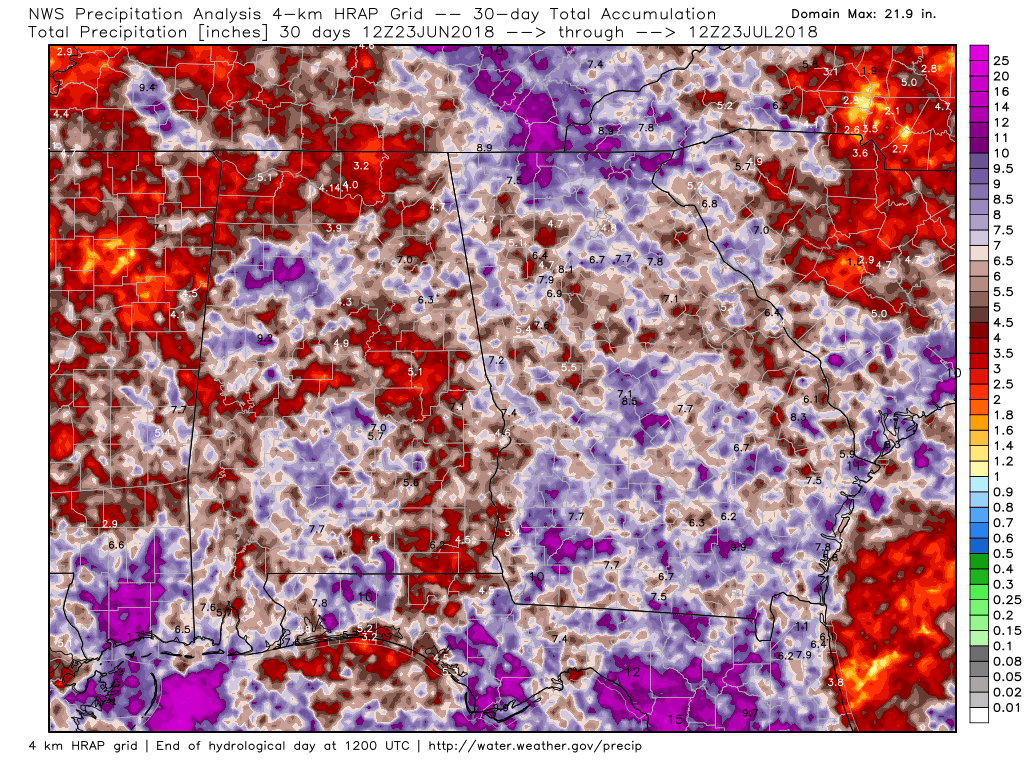
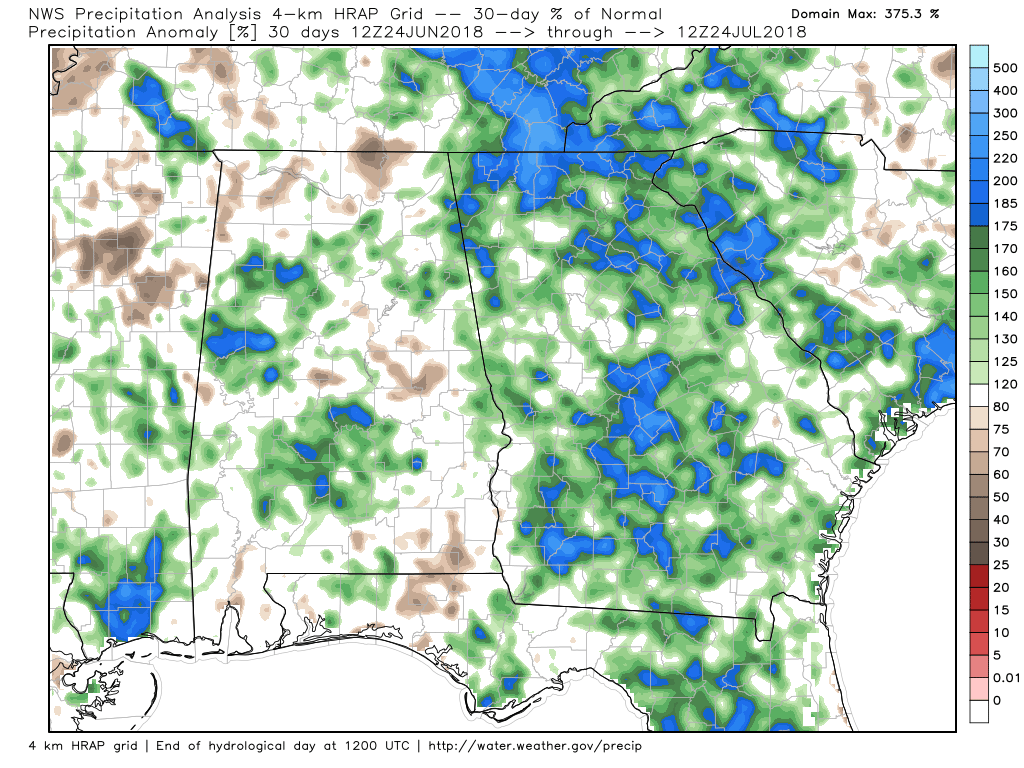
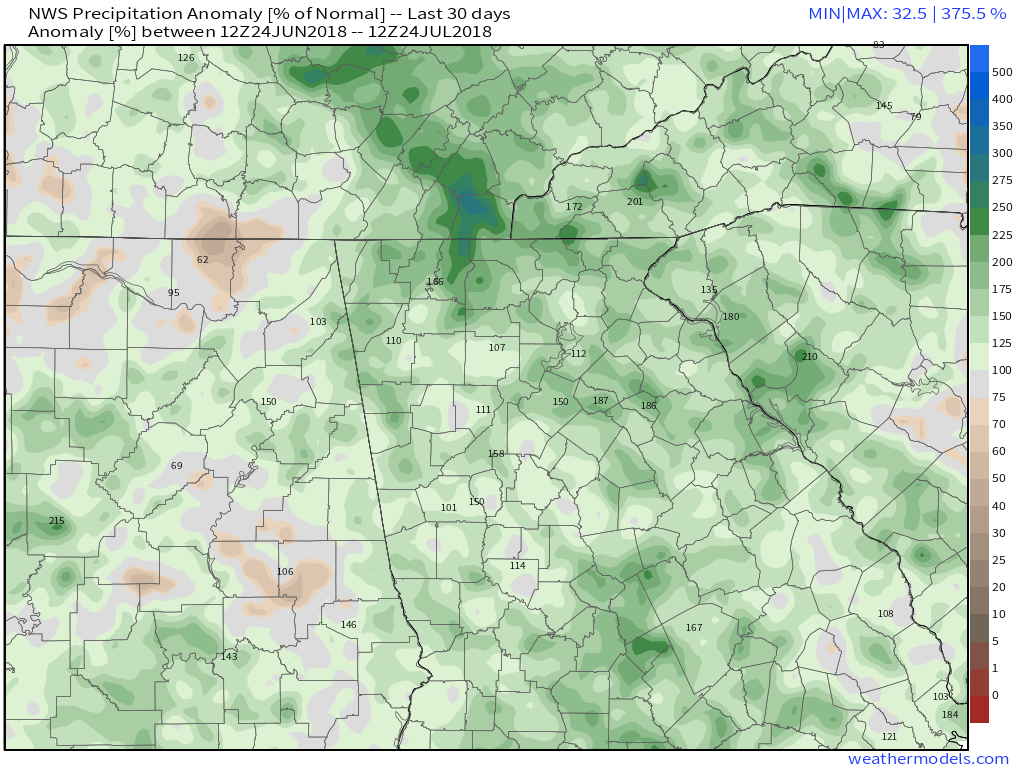
Last 30 DaysThe last 30 days has seen some very beneficial rainfall for all of Georgia. Some areas in the north are running almost 200% above normal for the 30 day period, but the amounts can vary quite a bit depending on where you live.
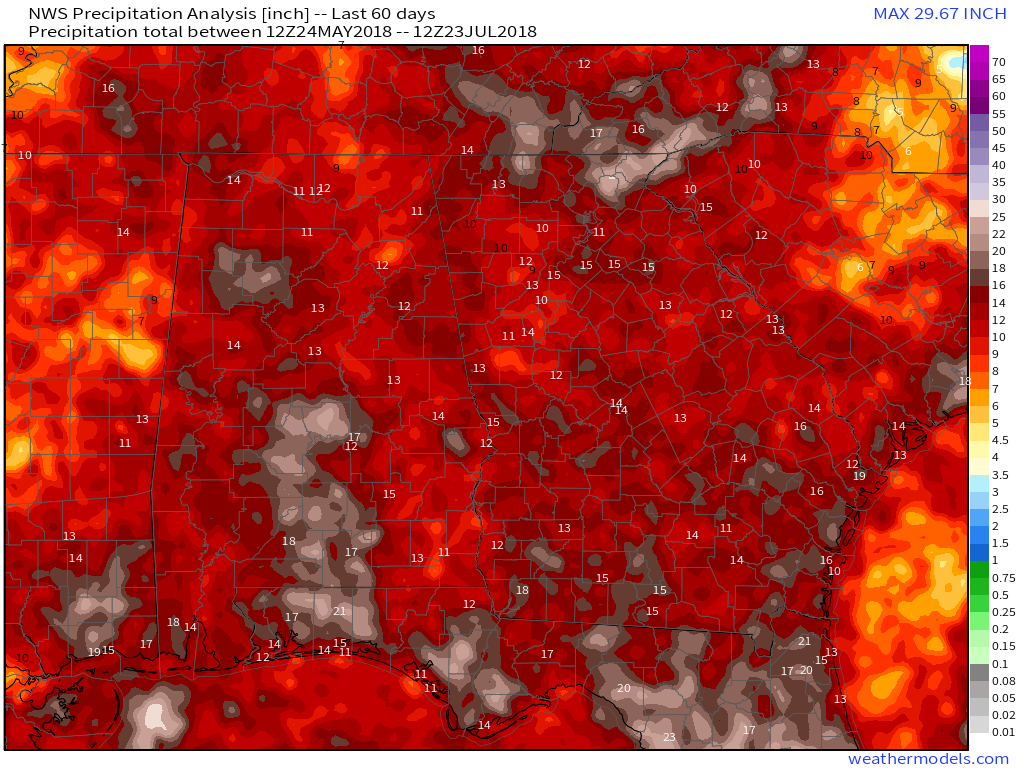
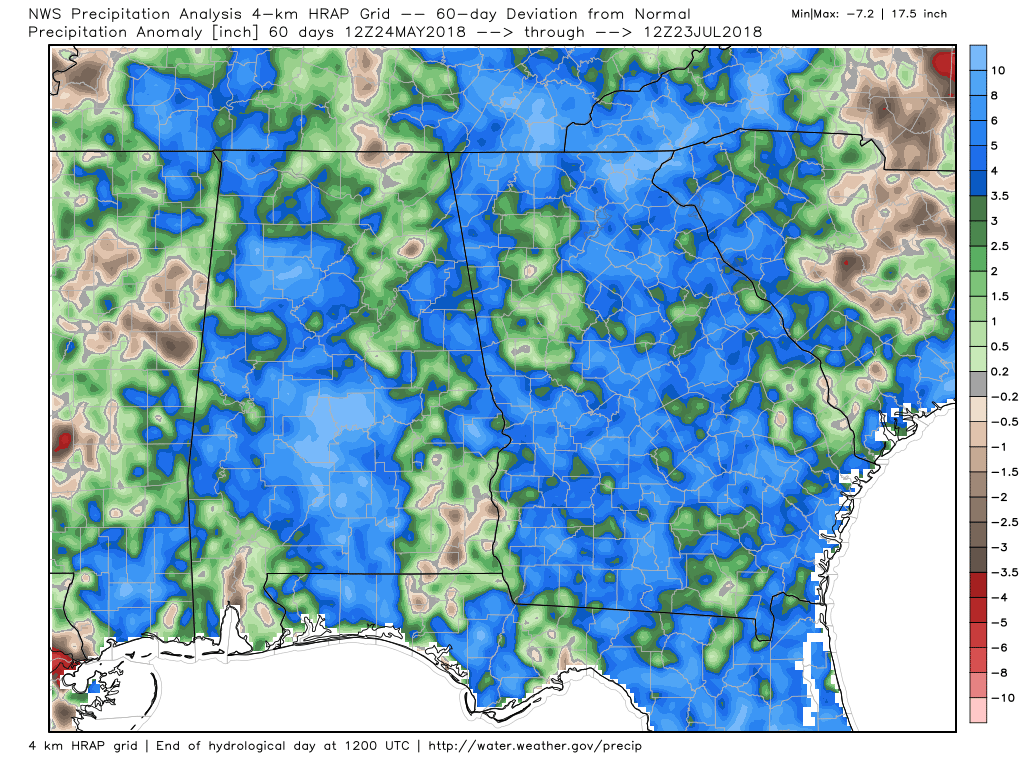
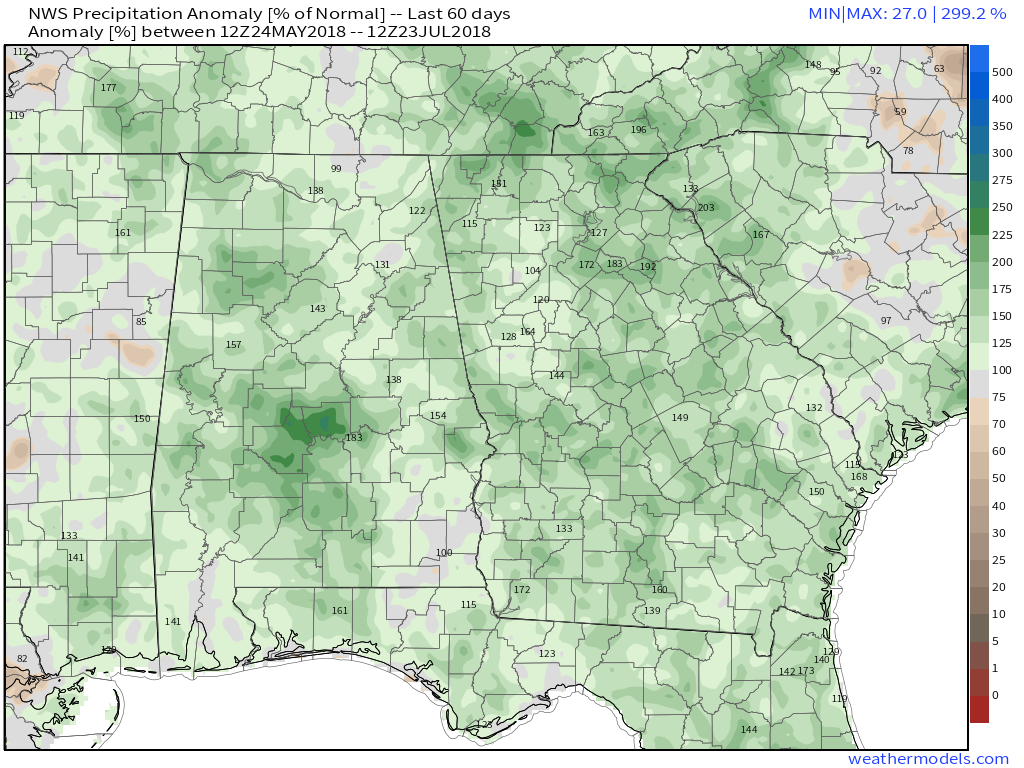
Last 60 DaysNothing very different from the 30 day period. Most every area is running about 3.5" above normal except for the Atlanta area, and Cobb, Douglas, and Fayette, which are normal to an inch or two above normal.
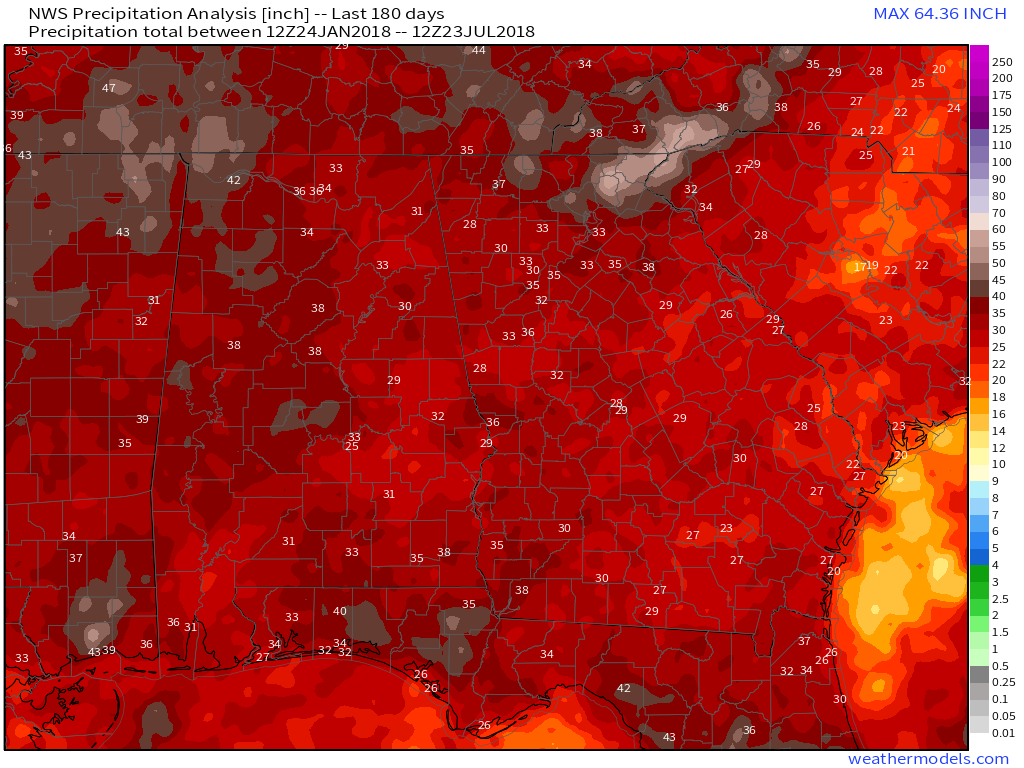
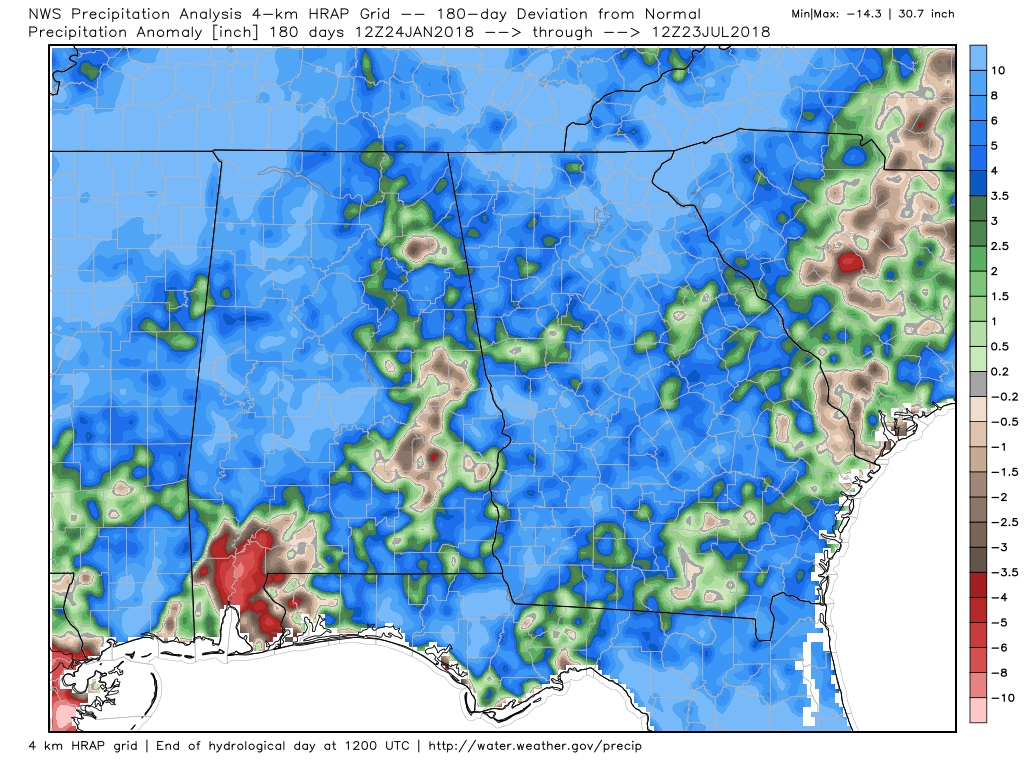
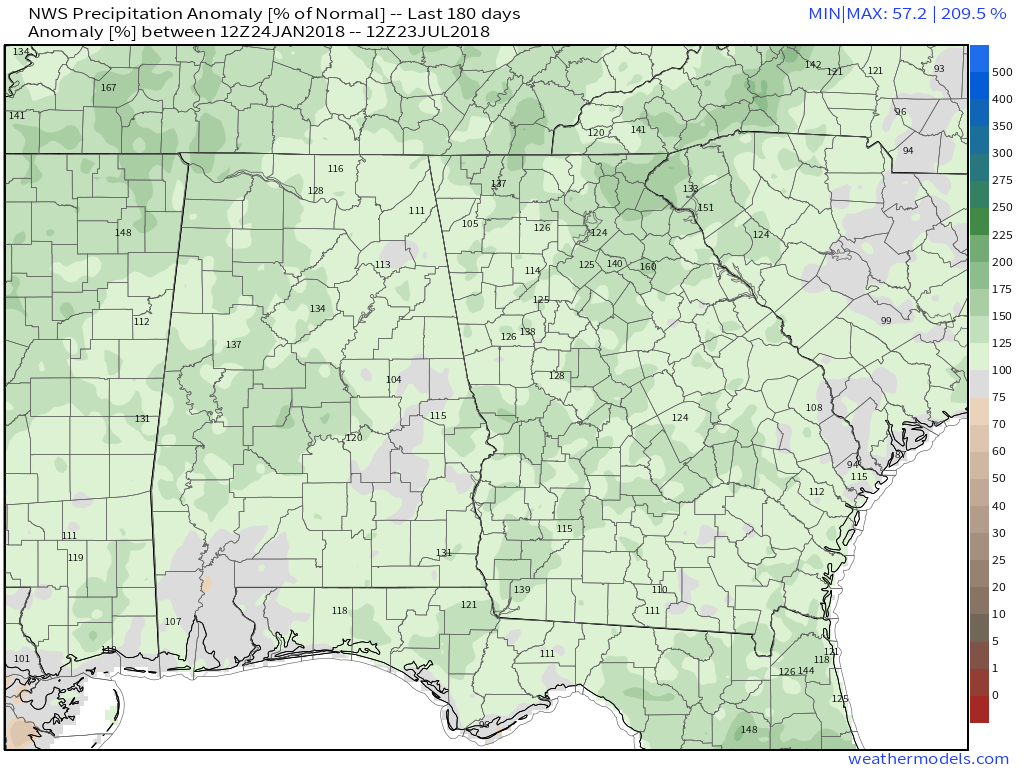
Last 180 DaysThe last 180 days are still running more than 100% above normal with some sites 120-140% above normal. Really no shortage of rainfall anywhere in Georgia.
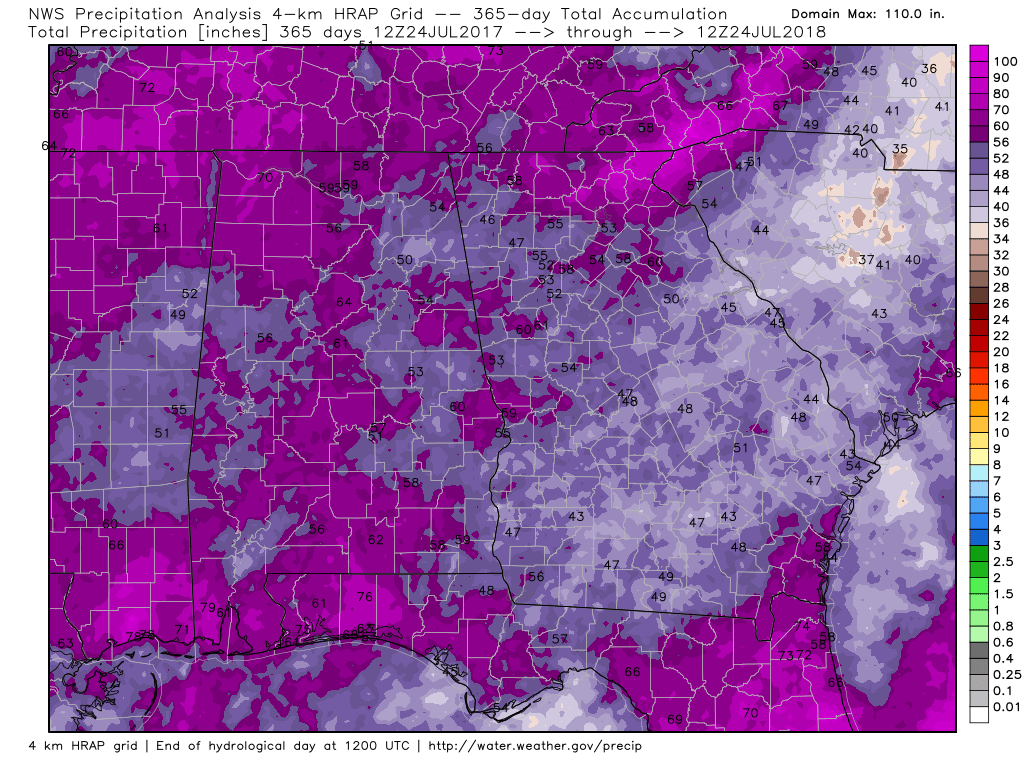
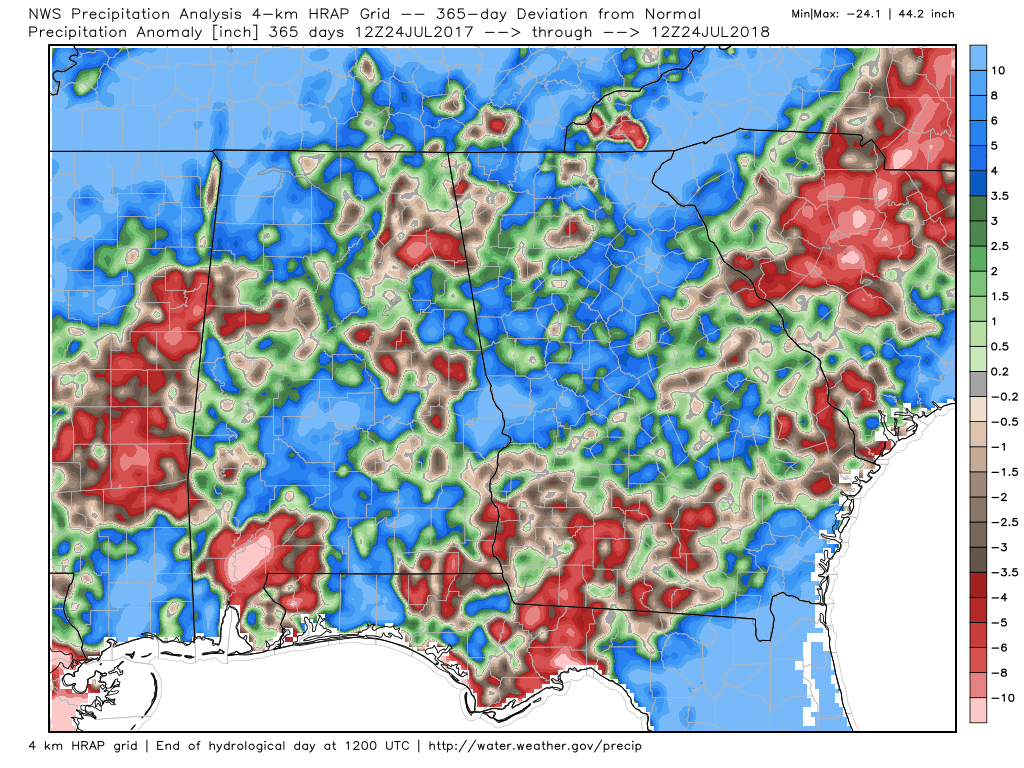
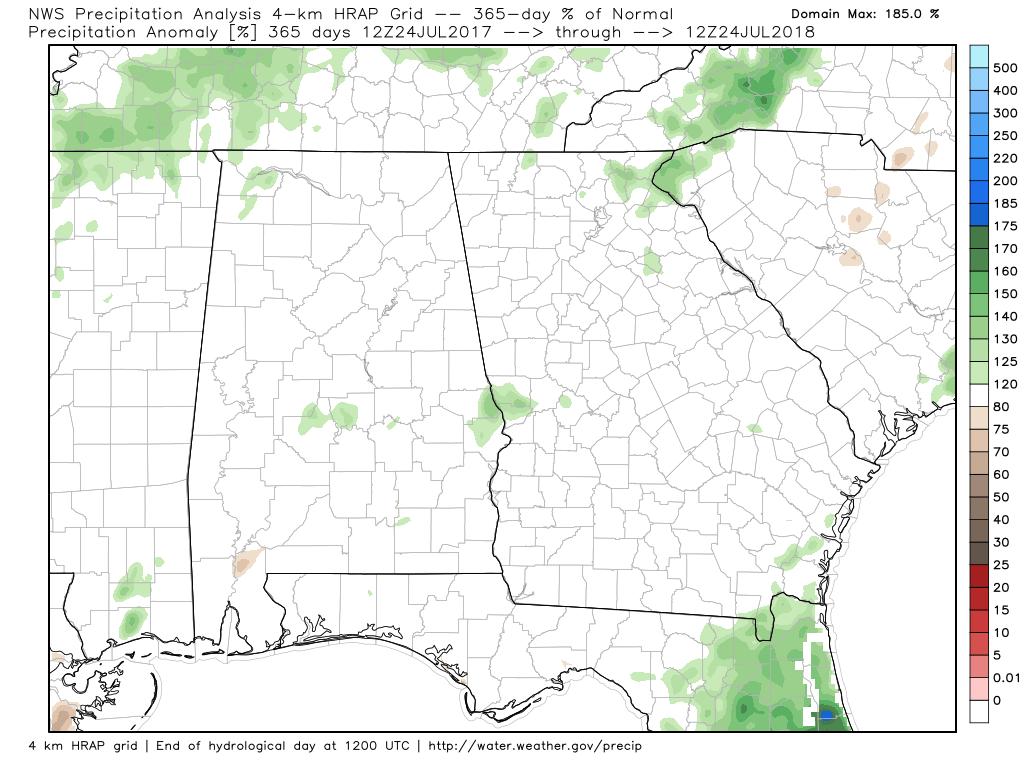
Last 365 DaysAs we go out in time, the anomalies decrease. Here's a look at the last 365 days.
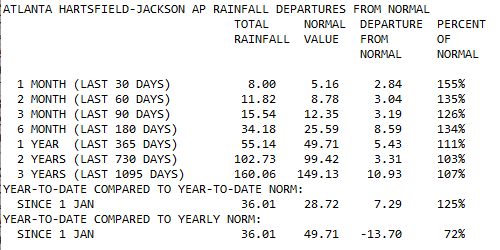
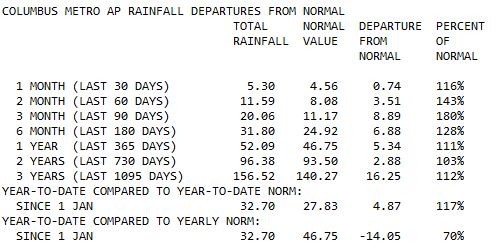
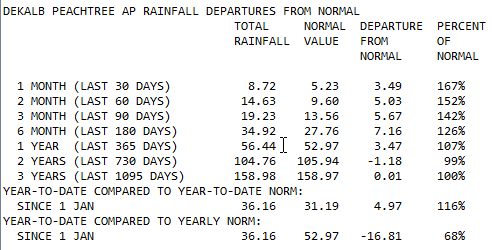
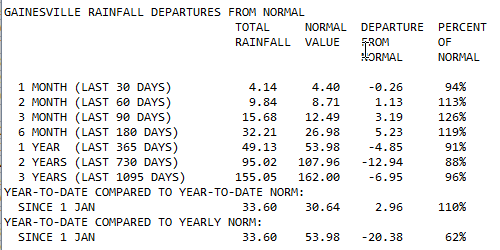
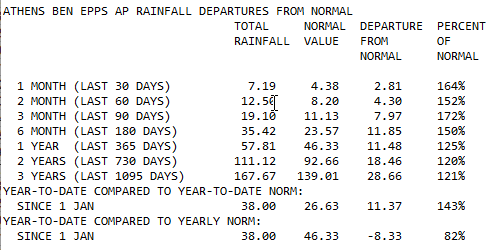
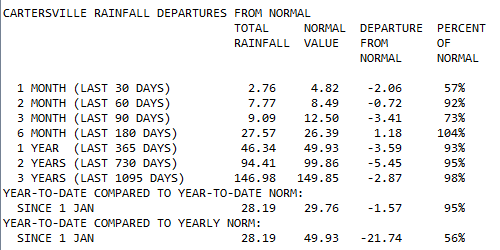
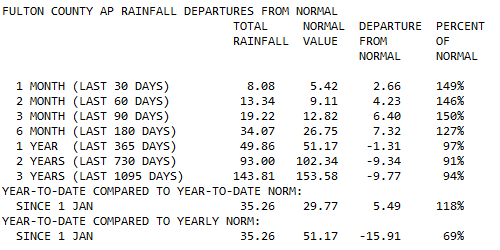
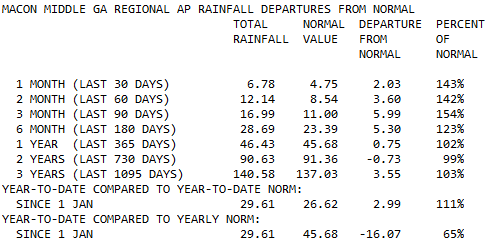
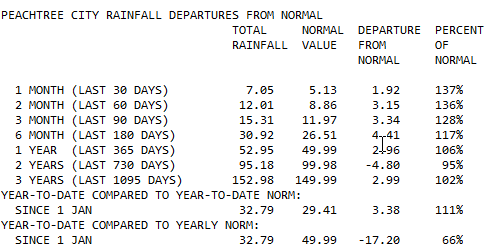
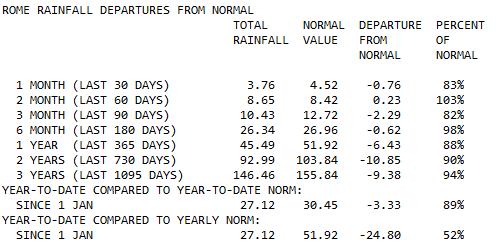
Atlanta Hartsfield One Month Precipitation Totals 2018 Atlanta Precipitation Precipitation Details for Various Georgia Climate LocationsClick on the images to enlarge
|
Archives
March 2019
Categories
All
|
OLD NORTH GA WX BLOG

 RSS Feed
|
Never base important decisions on this or any weather information obtained from the Internet. Always have a backup method of receiving weather information such as a battery powered weather radio.
Copyright © 2018 NorthGeorgiaWX.com and DaculaWeather.com 
|