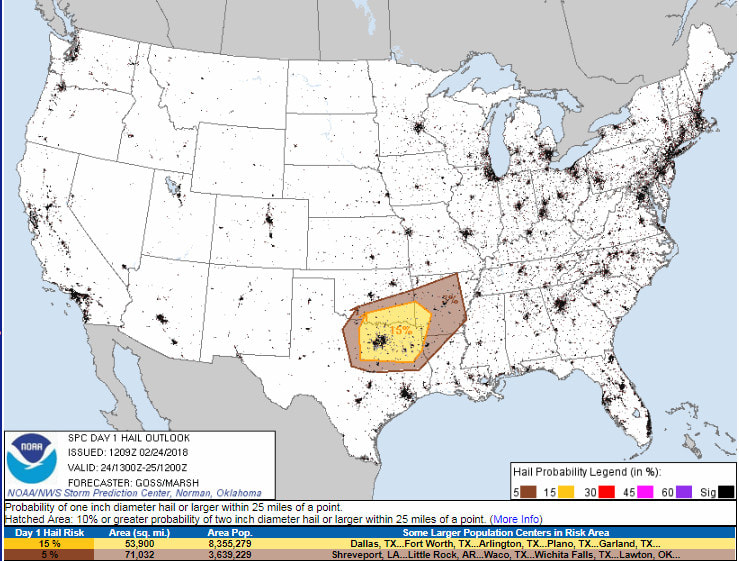
 SPC Severe Weather Outlook Day 1 SPC Severe Weather Outlook Day 1
It's getting to be the time of the year for dangerous weather, and this may be the first widespread severe weather outbreak of the late winter season. The severe weather we'll be watching will be to our west today and no real threat for us in Georgia, but some of this could get pretty nasty.
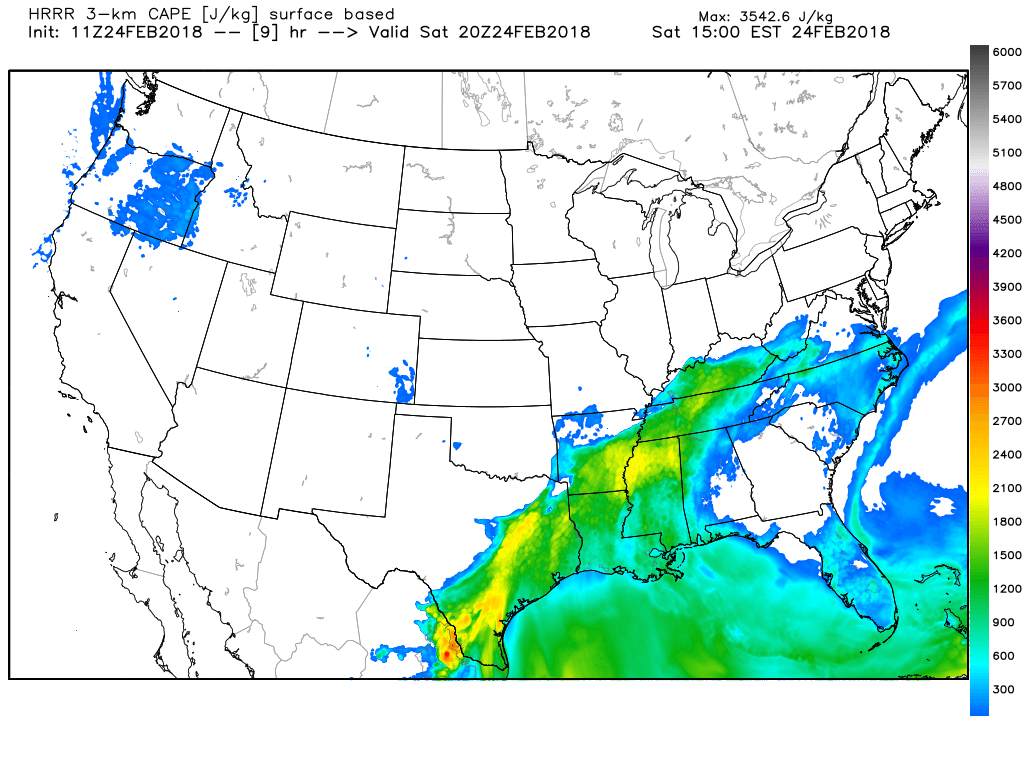
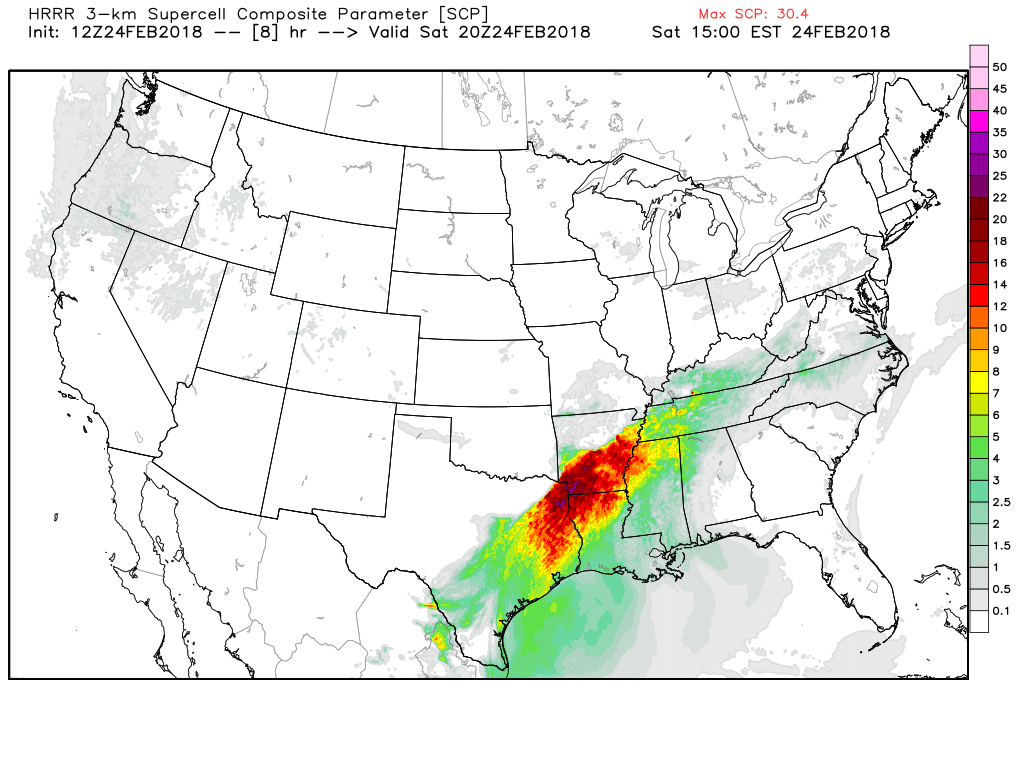
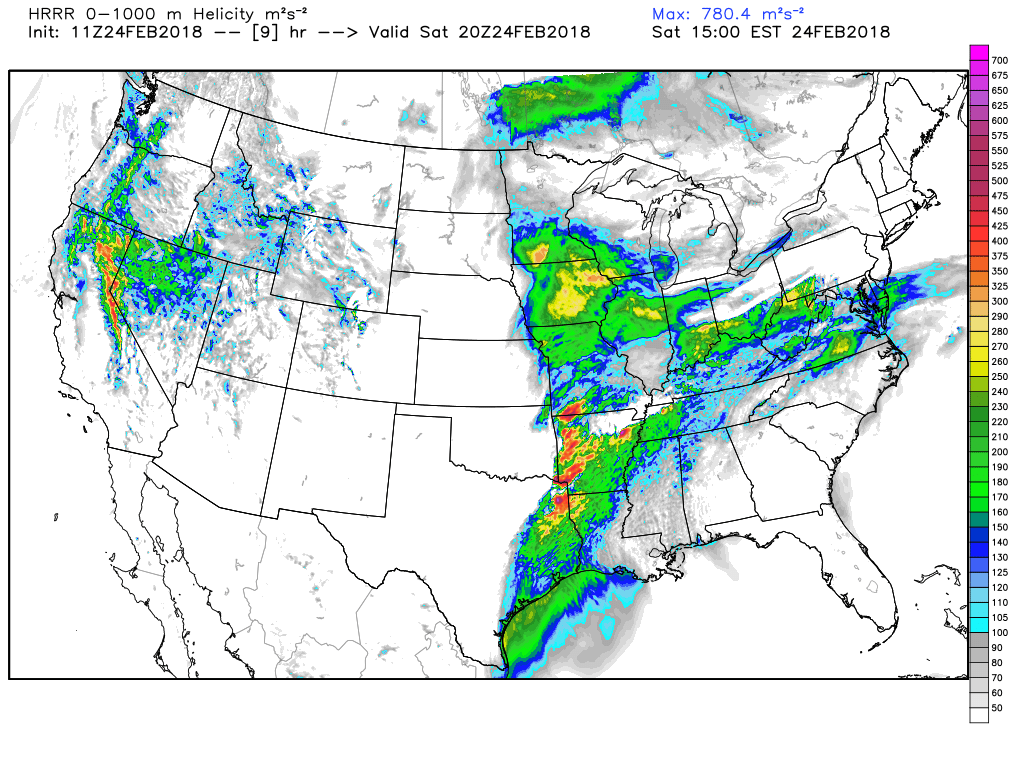
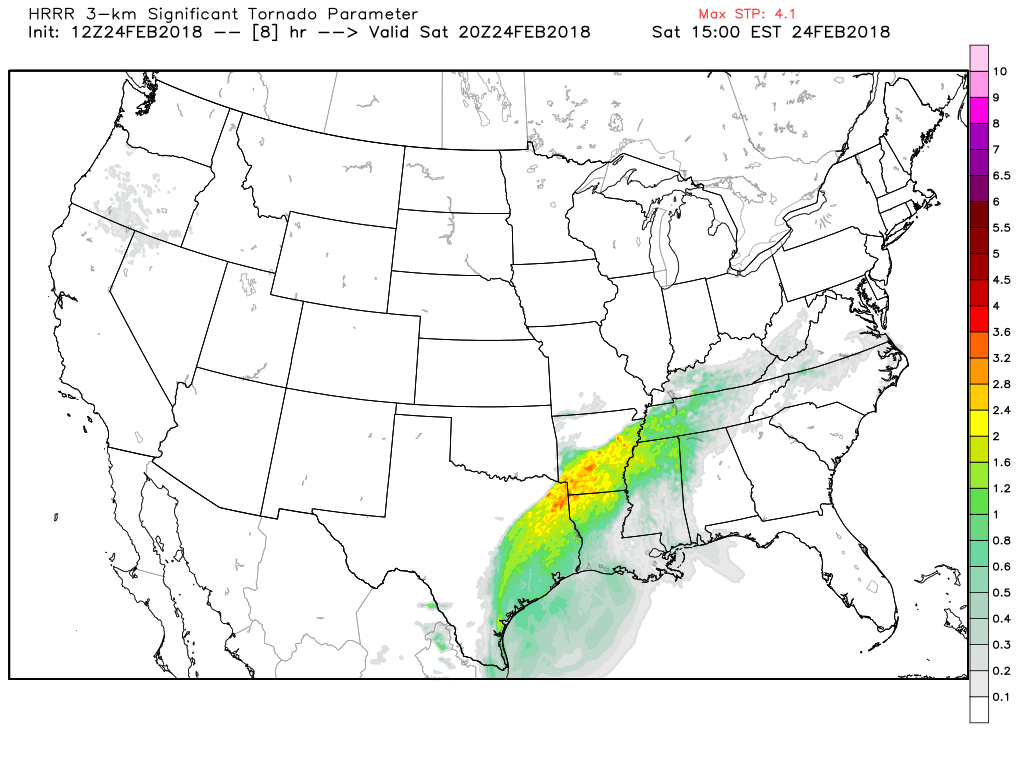
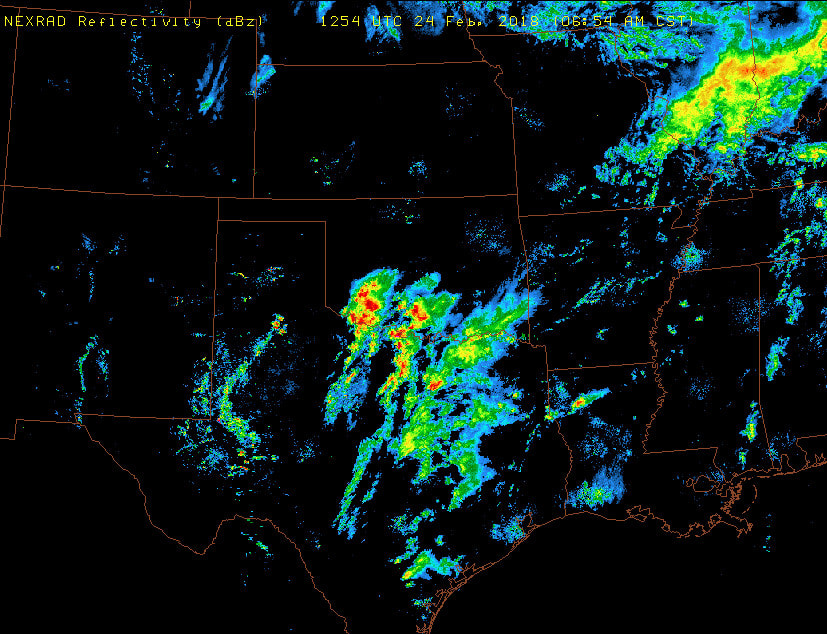
Storms are already breaking out over Texas and Oklahoma, but right now (when I was typing this) there was no severe weather being reported. Most of the action will occur later this afternoon and evening once the atmosphere gets stirred up a little. I have four HRRR model images showing some of the severe parameters we'll be facing today.
Here's a look at the current radar from two different radar applications.
Tweets
SPC Convective Outlook
This is a pretty long Day 1 Severe Weather Outlook... These can always be found on the Storm Prediction Center's website or here at DaculaWeather.com.
Day 1 Convective Outlook
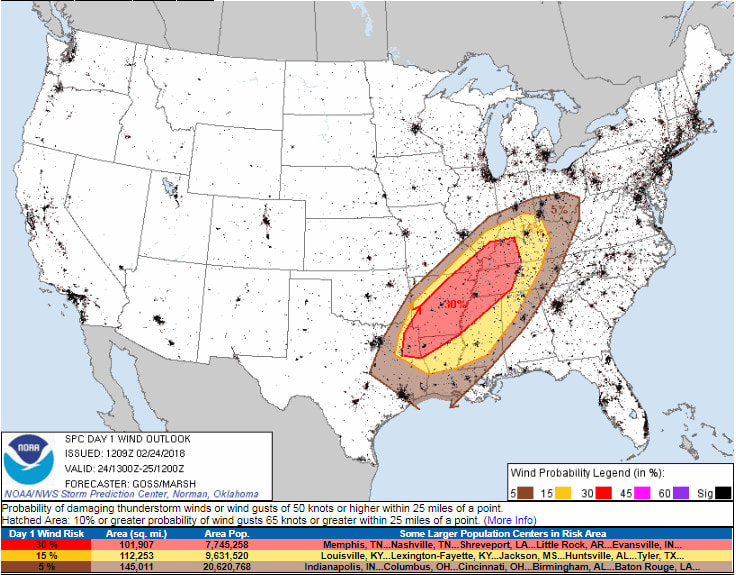
NWS Storm Prediction Center Norman OK 0609 AM CST Sat Feb 24 2018 Valid 241300Z - 251200Z ... THERE IS AN ENHANCED RISK OF SEVERE THUNDERSTORMS ACROSS PARTS OF NORTHEAST TEXAS... NORTHWEST LOUISIANA... ARKANSAS... SOUTHEAST MISSOURI... SOUTHERN ILLINOIS... FAR SOUTHWEST INDIANA... WESTERN KENTUCKY... WESTERN TENNESSEE... FAR NORTHWEST ALABAMA... NORTHERN MISSISSIPPI... AND NORTHERN LOUISIANA... ... THERE IS A SLIGHT RISK OF SEVERE THUNDERSTORMS SURROUNDING THE ENHANCED RISK,AND EXTENDING WEST INTO NORTH TEXAS... ... THERE IS A MARGINAL RISK OF SEVERE THUNDERSTORMS SURROUNDING THE ENHANCED AND SLIGHT RISK AREAS... ... SUMMARY... Severe thunderstorms are expected to develop today through tonight across northeast Texas and the Arklatex region, east northeastward through the lower Mississippi and lower/middle Ohio Valleys. The storms will be accompanied by potential for damaging wind gusts and a few tornadoes, a couple of which could be strong. Hail will also be possible across the Texas and Arklatex portions of the outlook. ...Synopsis... Large-scale troughing will persist over the western and central U.S. this period, while ridging holds fast across parts of the Southeast and adjacent western Atlantic. At smaller scales, an energetic short-wave trough -- embedded within the larger-scale cyclonic flow -- is crossing the central and southern Rockies, and will progress east-northeast across the Plains, reaching the upper Great Lakes by the end of the period. At the surface, a rather weak/ill-defined pattern is evident at this time, per latest surface analysis, with a very weak low over far northeast Oklahoma, a warm front extending roughly eastward to Kentucky, and a cold front extending southwest across eastern Oklahoma and north central Texas into the Concho Valley and Big Bend area. With time, as the upper system shifts east-northeast, the northeast Oklahoma low is progged to gradually deepen/shift slowly north-northeast across Missouri today, and then advance more rapidly north across Illinois into the western Upper Great Lakes region overnight. As this occurs, a strengthening cold front will move eastward in the wake of the low, extending across Arkansas and eastern Texas by sunset, and then accelerating east to reach a position just to the lee of the Appalachians by the end of the period (early Saturday morning). This front will focus a zone of strong/severe storms through the period. ...Portions of North Texas east across the lower Mississippi and Tennessee Valleys, and northeast to the Mid-Ohio Valley... Elevated Convection has begun to develop across the eastern two-thirds of Texas this morning, as large-scale ascent increases atop a still-stable boundary layer as the southern Rockies upper system advances. With steep lapse rates over the area supporting moderate CAPE and strengthening mid-level flow, a few of these storms will pose a risk for producing large hail. Several complicating factors with respect the evolving severe risk -- primarily centered around the developing Texas convection and more widespread storms which have been ongoing from the Ozarks east across the Ohio Valley states. Resulting cloud cover and reinforcement of cool air to the north of the warm front will affect potential for any later-day heating/destabilization, and so later adjustments to the outlook may be needed as the environment evolves. With that said, very strong/veering wind profiles with height -- already indicated particularly over western portions of the region -- will continue to strengthen, as stronger flow aloft associated with the advancing upper trough overspreads the outlook area. By afternoon, very large, sickle-shaped low-level hodographs -- representative of low-level shear highly favorable for updraft rotation -- can be expected, suggestive of tornado potential with any sustained/stronger storms. However, as implied above, thermodynamic concerns will temper overall risk to some degree. At this time, expectations are that ongoing Texas convection to spread northeastward across eastern Oklahoma/Arkansas with time, with new storm development late this morning/afternoon occurring across northeast Texas/southeast Oklahoma/the Arklatex region. While storm mode should trend toward a linear configuration near the front, supercells -- perhaps just ahead of the line but particularly within what is likely to be a complex line with LEWPs and bows -- are expected to evolve. Along with risk for fairly widespread damaging winds, a few tornadoes will be possible. Greatest tornado risk -- including potential for a couple of strong tornadoes -- is expected within a corridor from the Arklatex area northeast across Arkansas into the southeast Missouri/southern Illinois/western Kentucky/western Tennessee area this afternoon and evening. Greatest wind risk will exist along a similar corridor. Overnight, as convection spreads east across the Mississippi Valley, storms will eventually begin to diminish in intensity -- due both to a decrease in instability, as well as low-level flow becoming aligned more parallel to the front as the upper system shifts northeast toward the Upper Great Lakes region, away from risk area. Until then however, risk for a tornado or two within the complex convective line along with damaging wind risk can be expected into the western Kentucky/western and Middle Tennessee/northwest Alabama/northern Mississippi/northern Louisiana areas.
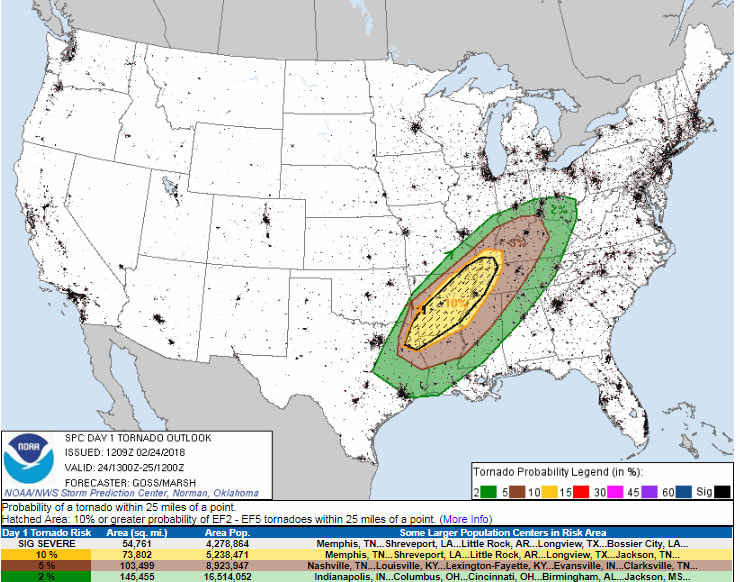
Tornado Probabilities
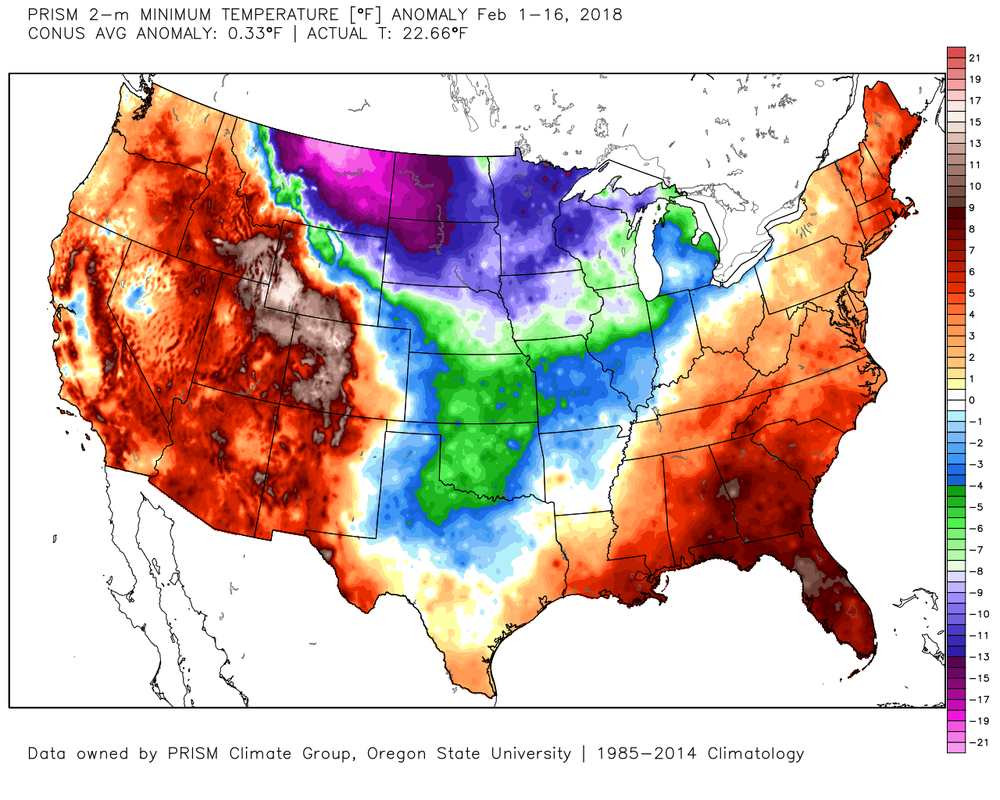
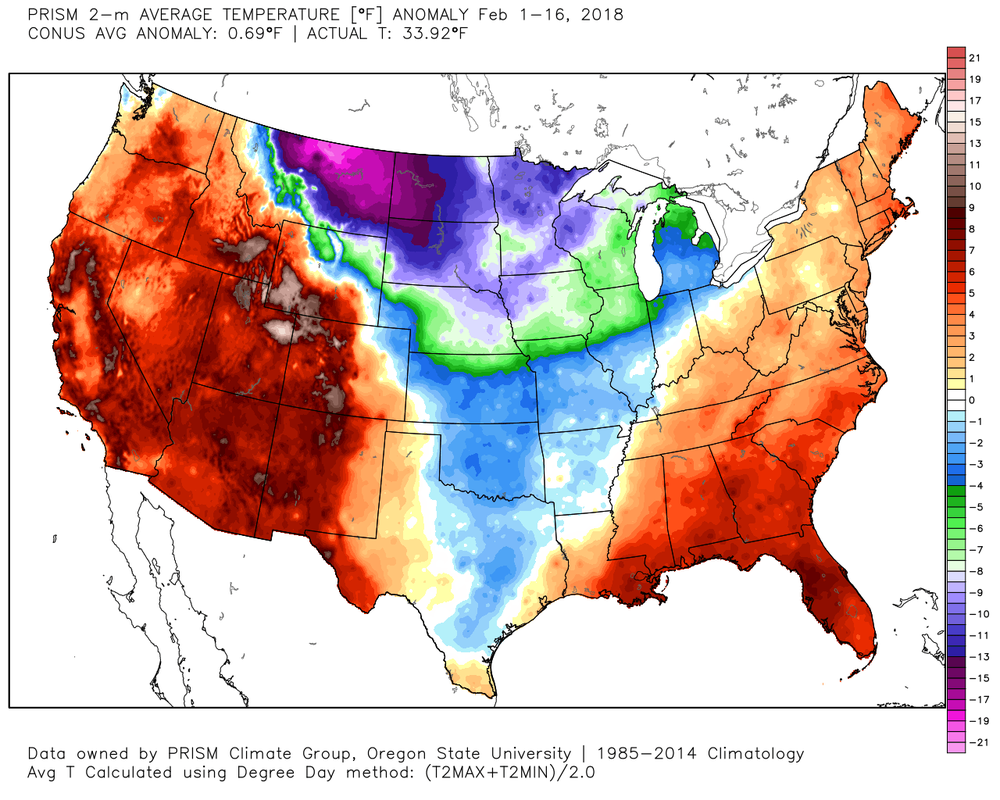
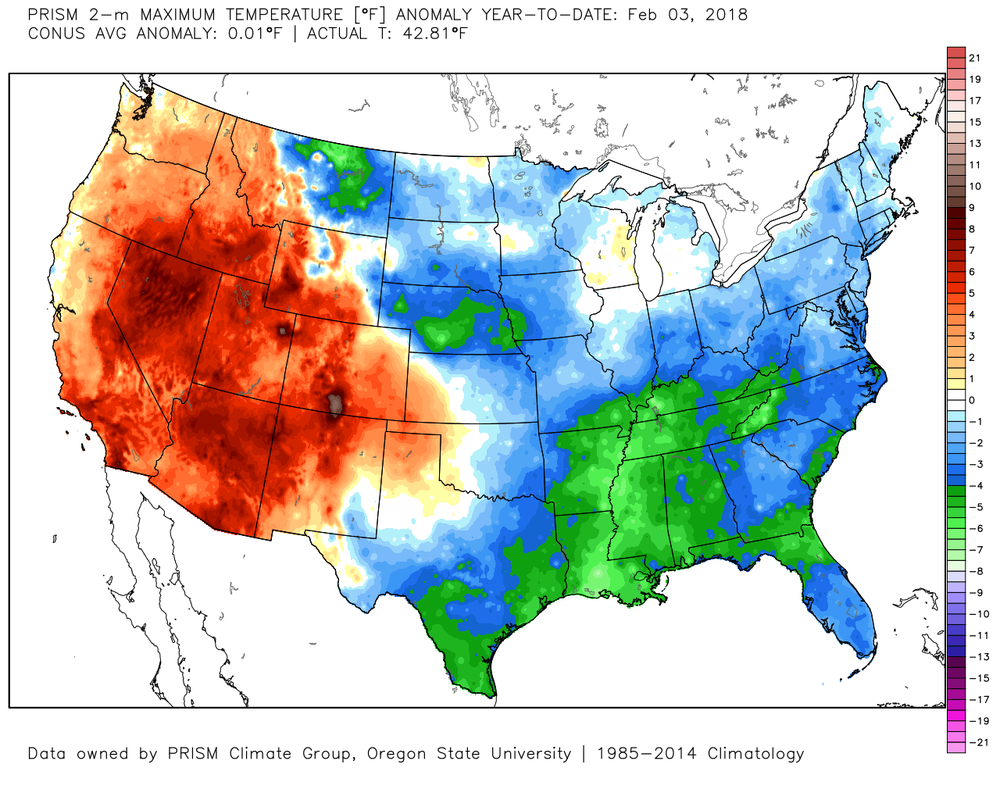
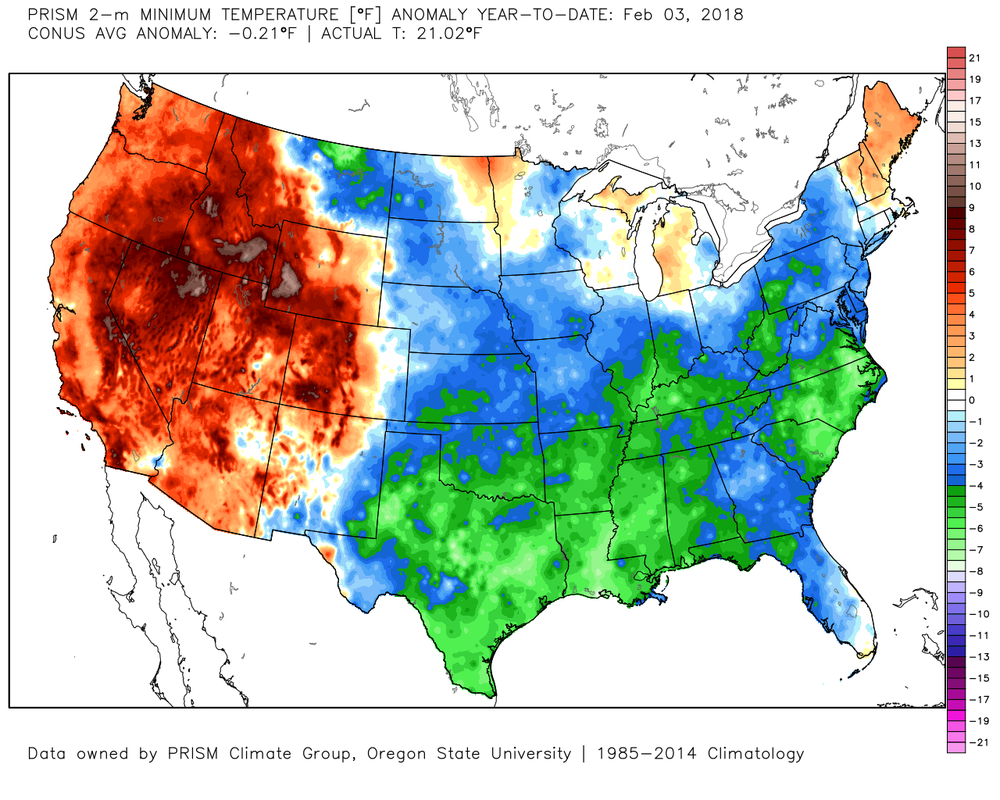
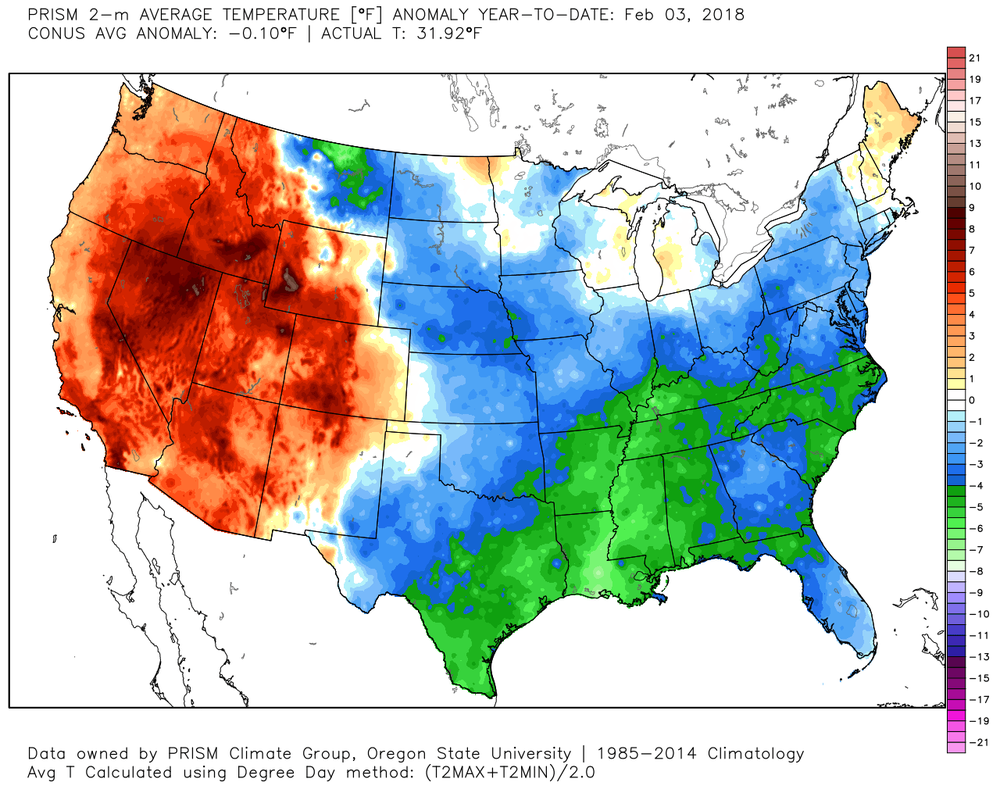
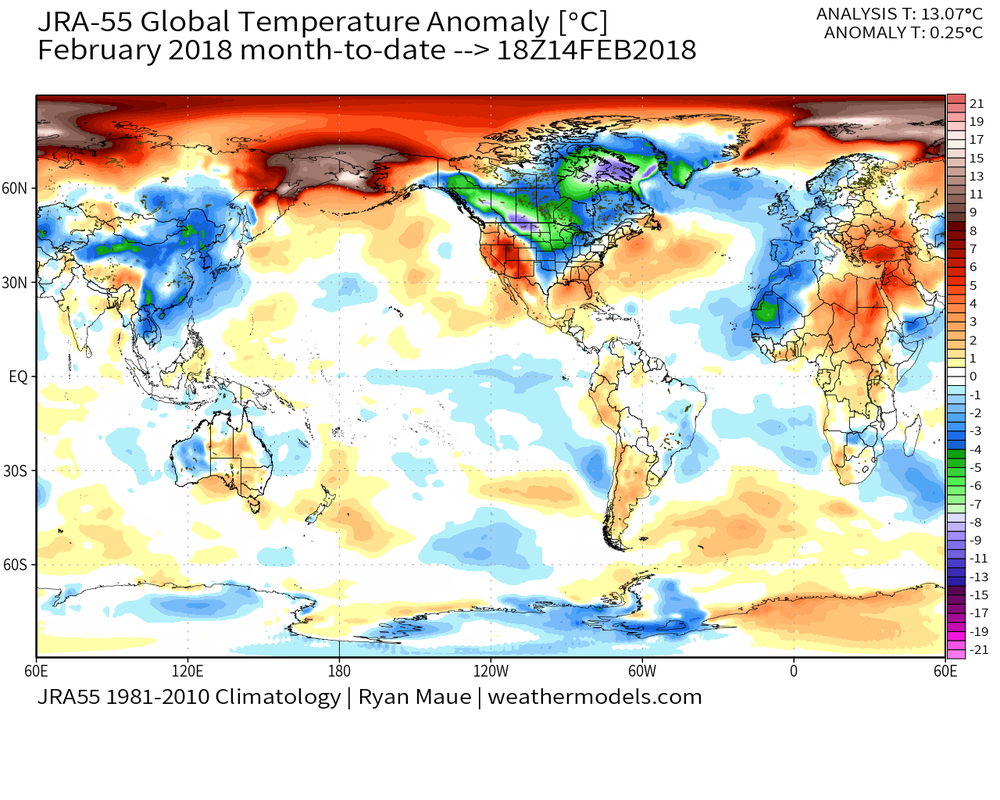 February 2018 Global Temp Anomalies February 2018 Global Temp Anomalies It's been warm this month, no question about that. But how warm has it really been and where do we stand as far as our warm records go? The big world picture shows that for the month to date, February is running about 0.25º C above normal. This data comes from Temperature analysis (T319) from Japanese Met Agency (JRA-55 Reanalysis) and graphics from Dr. Ryan Maue's new website at http://wx.graphics/. So far the year to date anomaly is 0.28º C or about 0.50º F above normal. 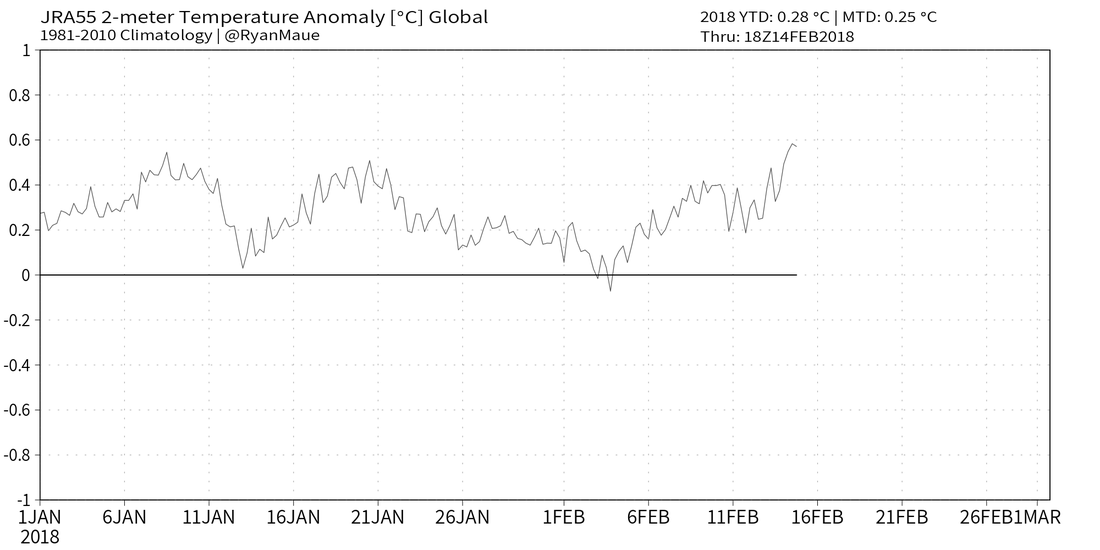 Lets look at February and see where we stand for the month. The three images below are the temp anomalies for the month and they show the max, min, and avg temp anomalies from left to right, and as always, you can click on any image to enlarge it. As you can see, the cold air has been confined to the central part of the country for the most part, while both coast basked in very warm temperatures. Overall the lower 48 states have averaged about 0.7º above normal. I would suspect the anomalies will go up some over the next 7-10 days before we return to more normal or even below normal temps.
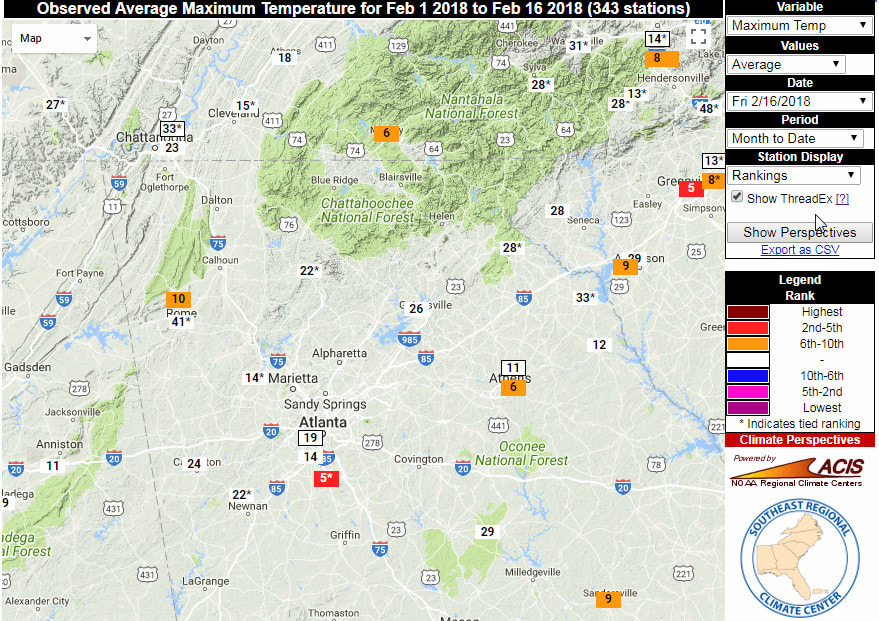
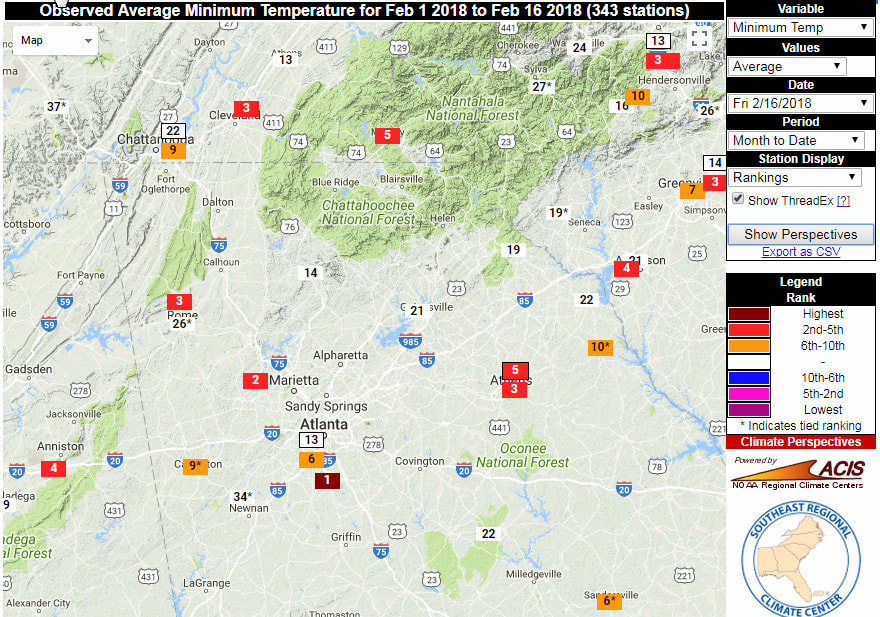
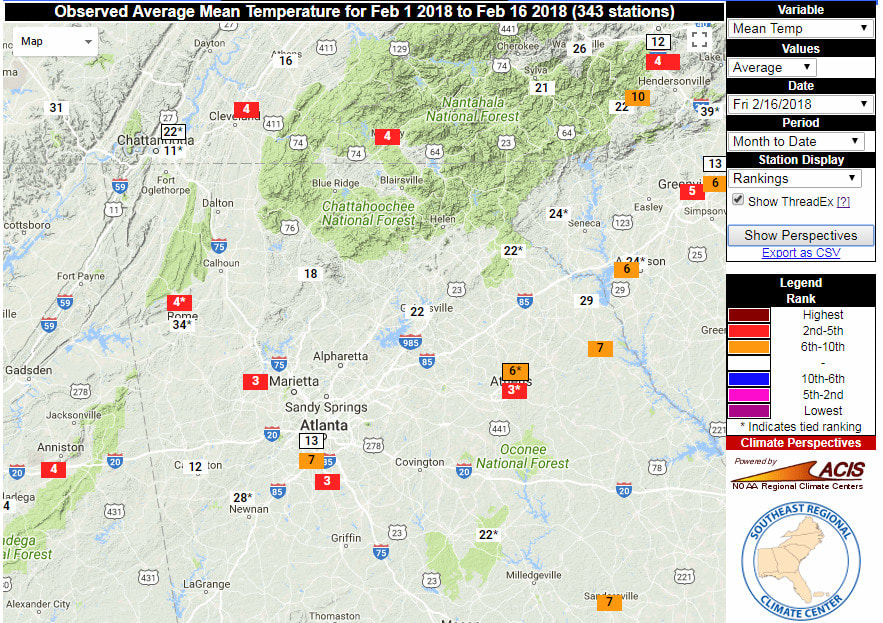
The three images below come from the Southeast Regional Climate Center. Instead of showing temps or anomalies, these images show the temperature ranking for various sites across the southeast so far for February. Max is left, Min is center and Avg is right. So a ranking of 1 would be the warmest period in that sites data records.
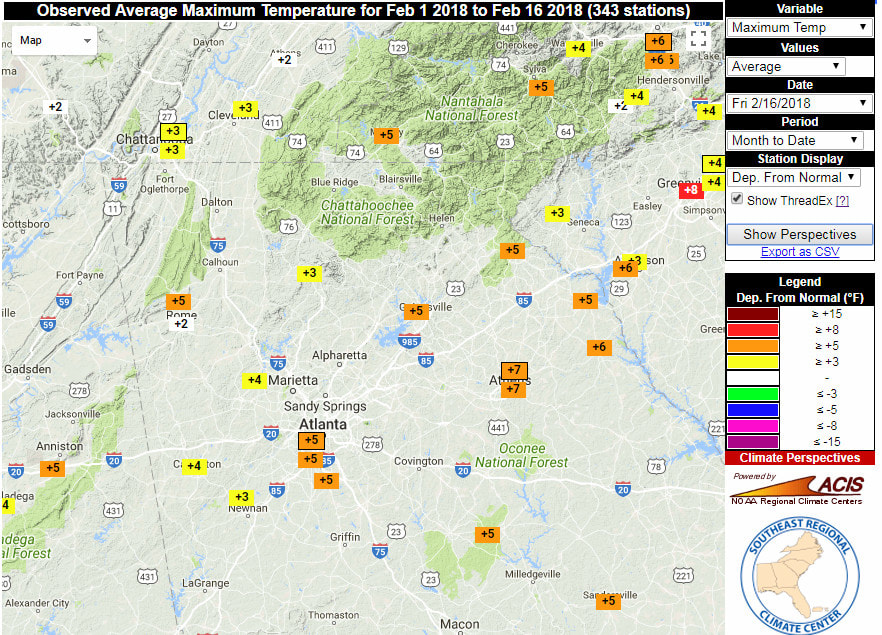
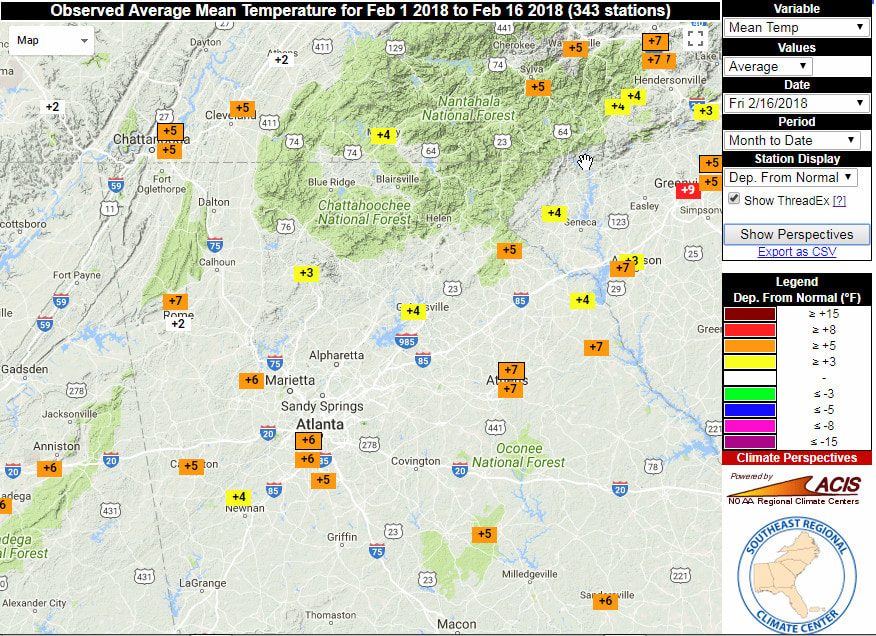
The images below are the temperature anomalies for the month to date from the official sites. Again, max, min, and avg from left to right.
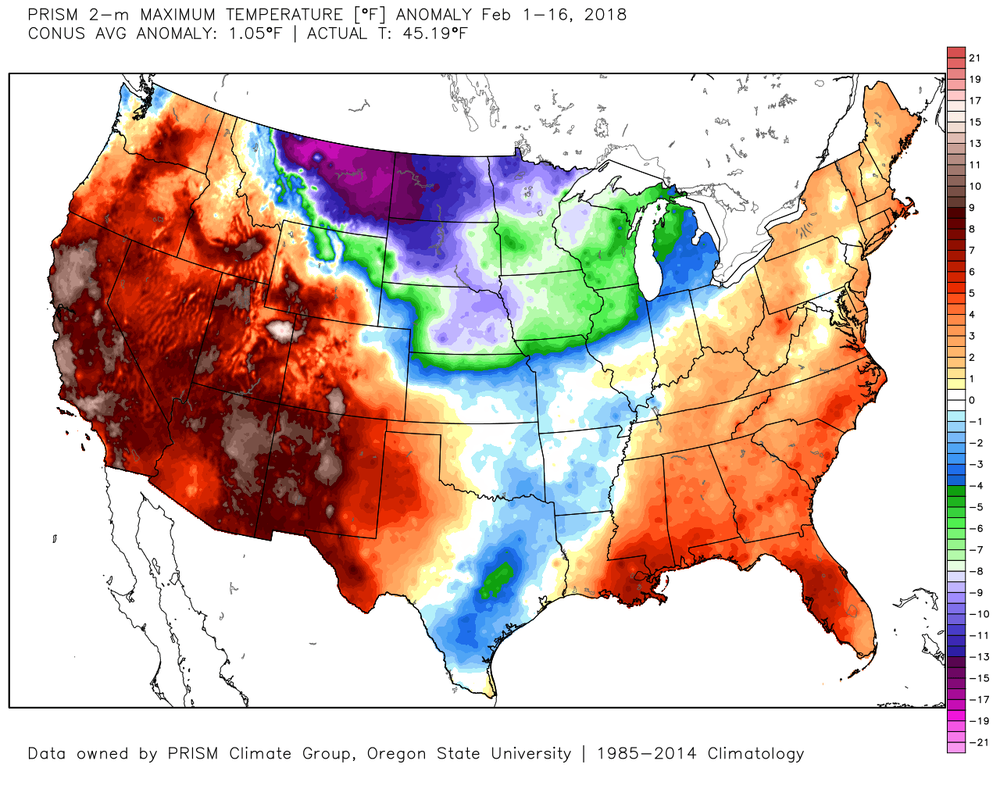
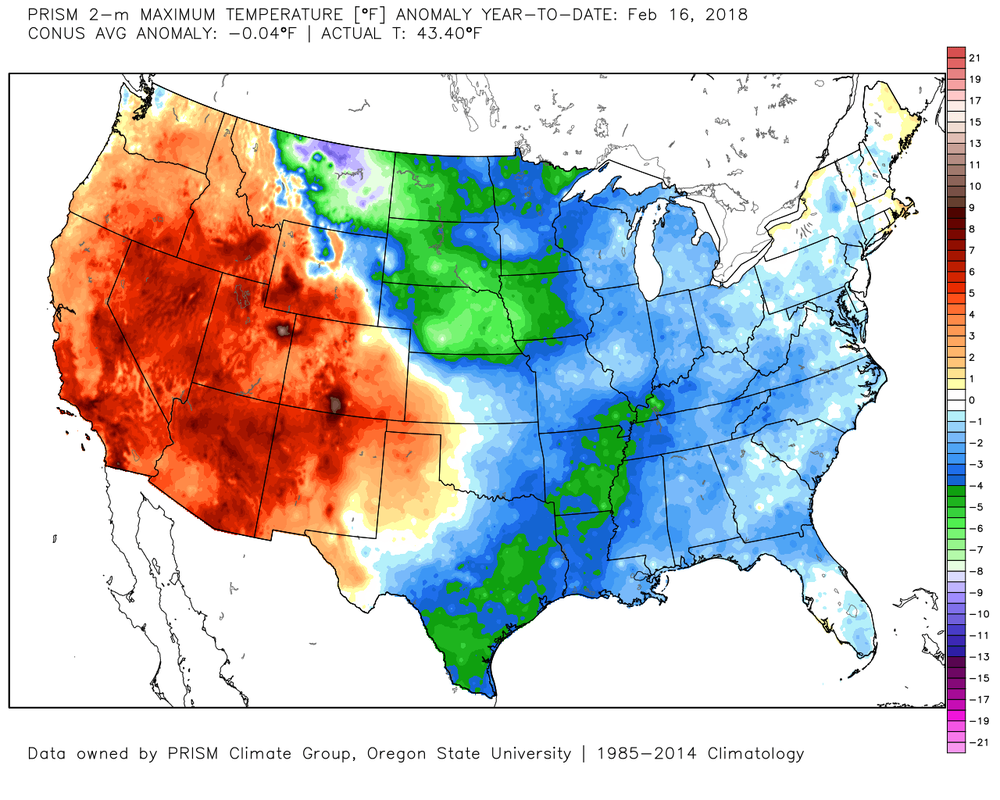
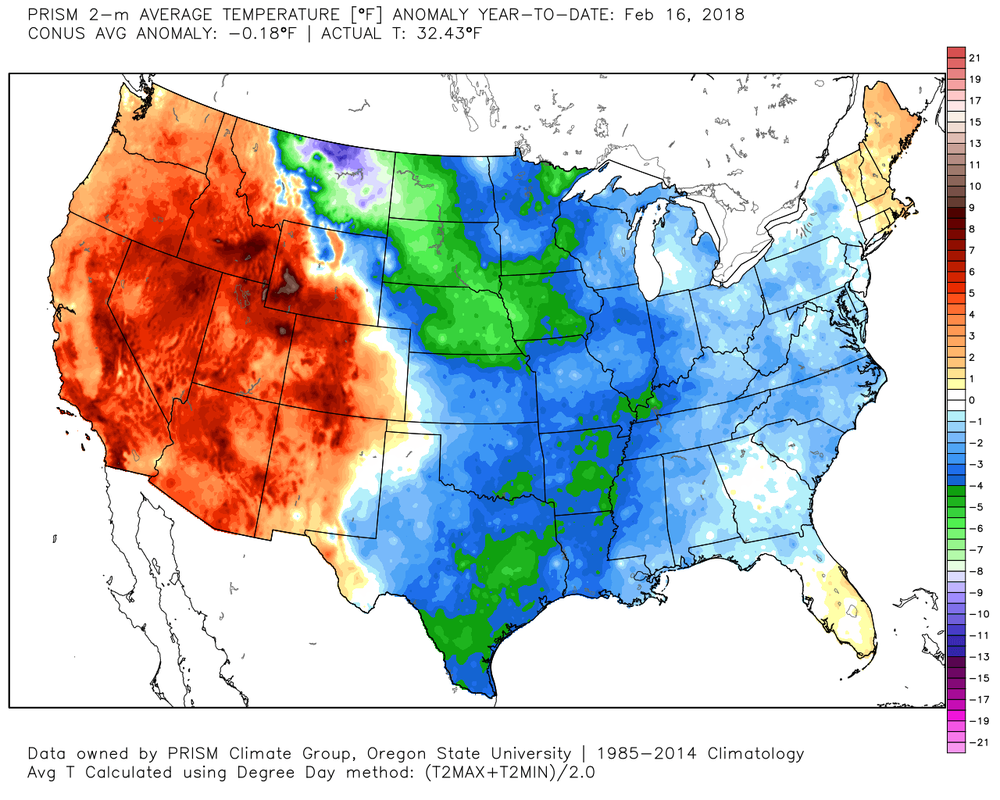
So we know February has been a little warm, but if we go back to the start of 2018, we begin to see a slightly different picture. We still see that the western part of the country was warm, but the east was normal to below normal. Keep in mind that these three images also include the warm February temps, so despite the warmth we've had so far, our year to date temps are still right around normal here, while a good part of the country was below normal.
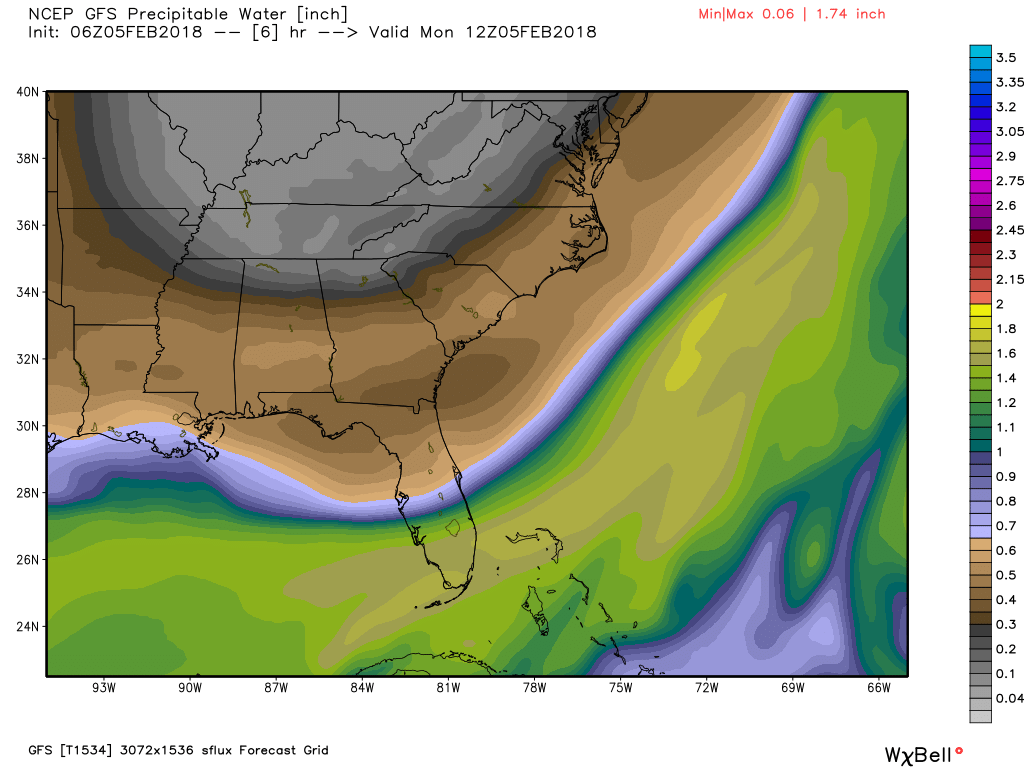
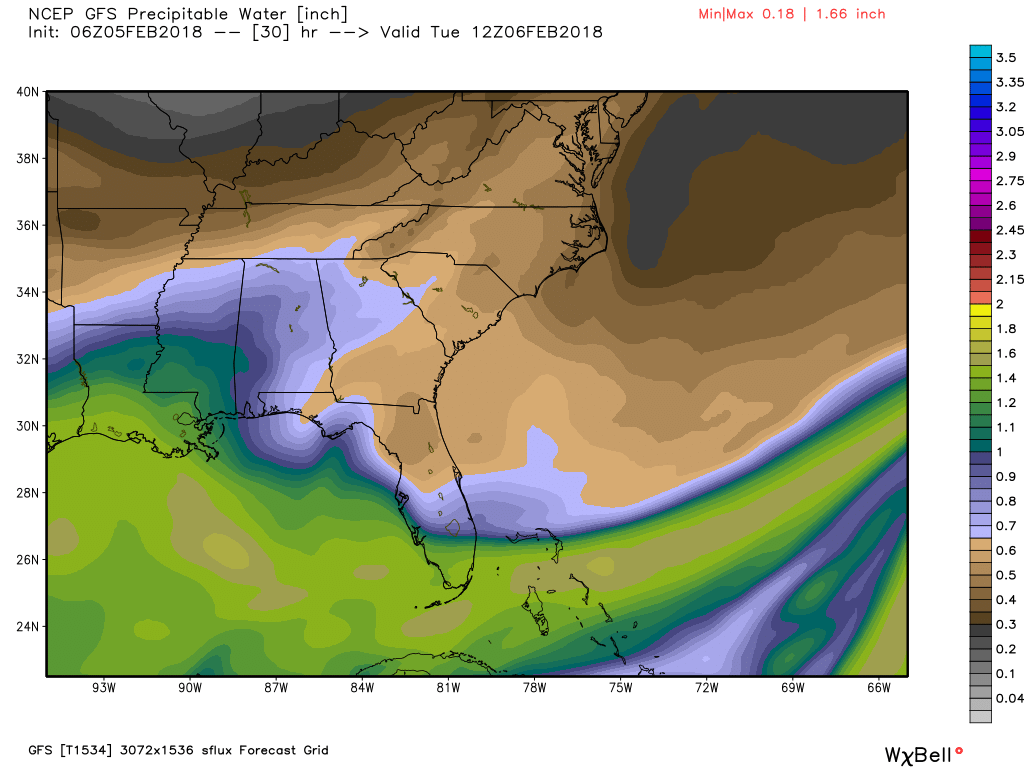
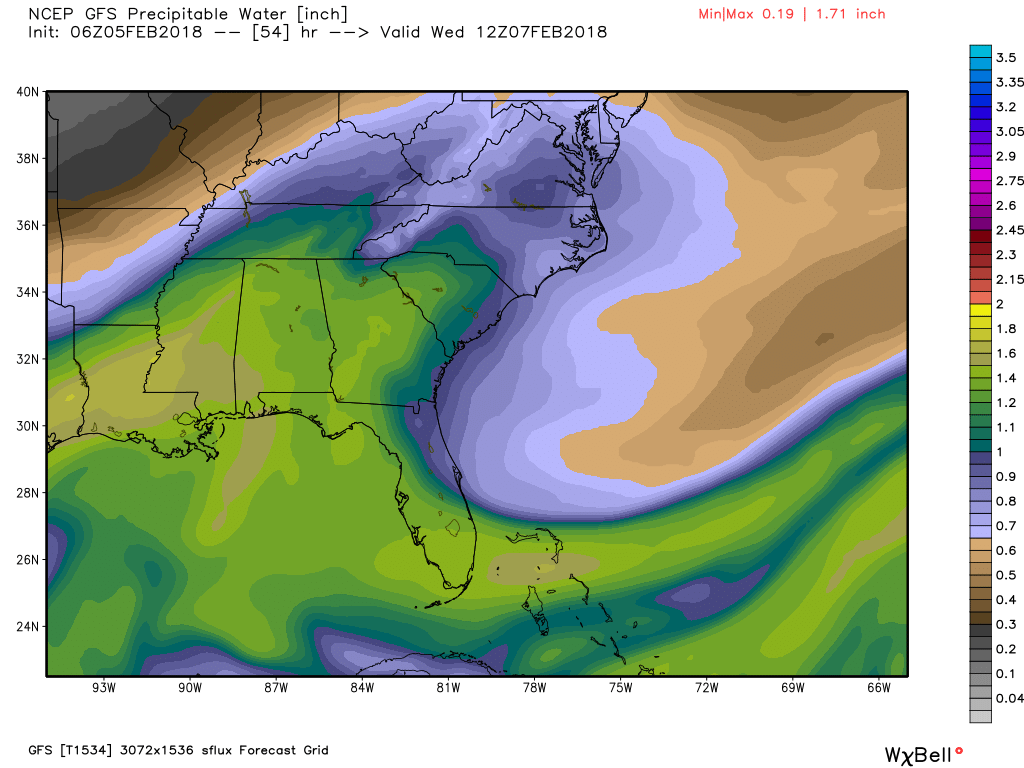
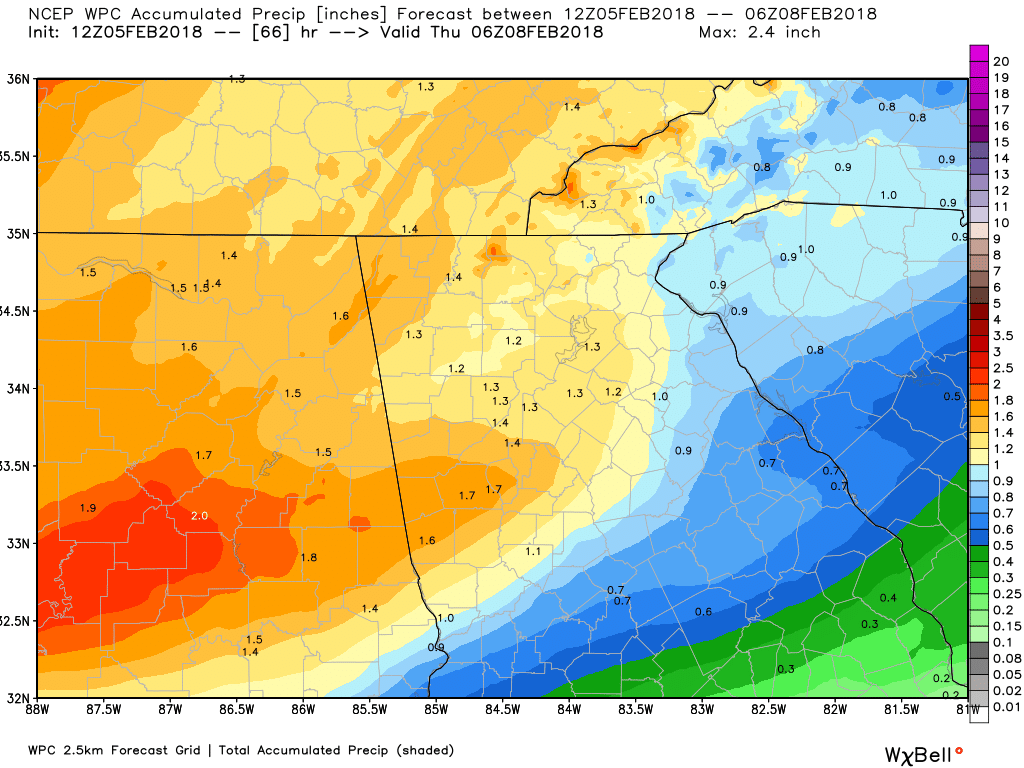
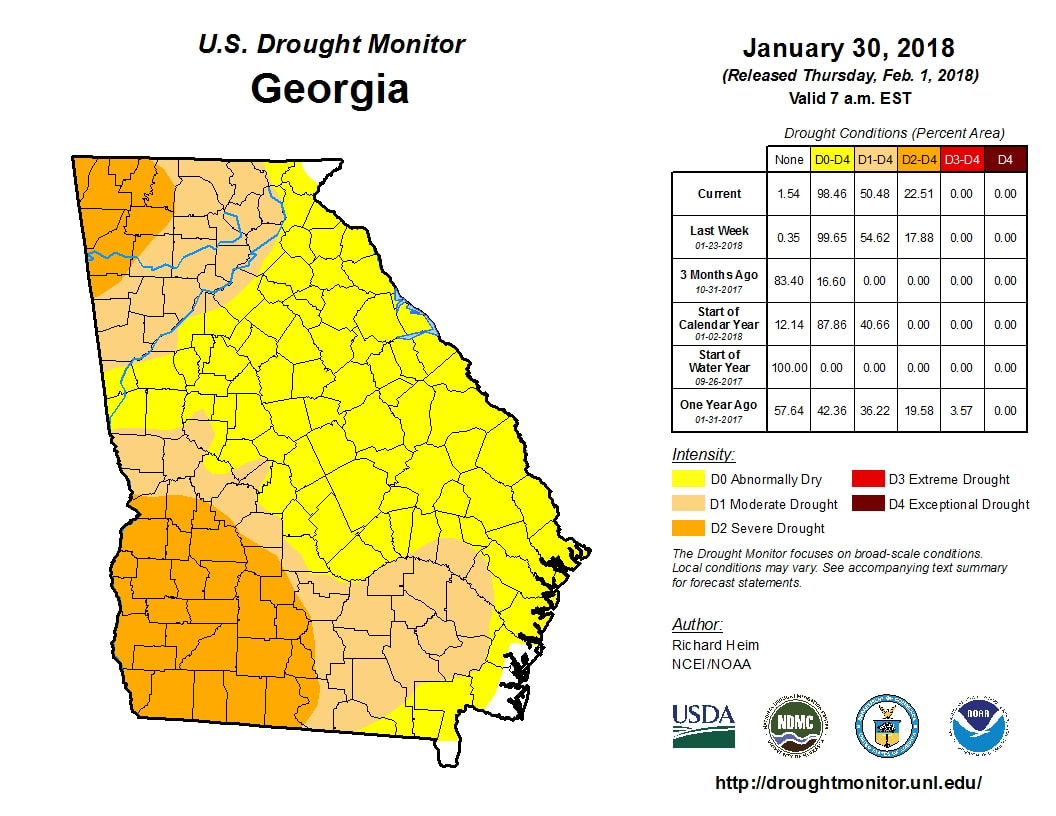 Most recent drought map (Updates Thursday) Most recent drought map (Updates Thursday) One benefit of the warmer temperatures has been the rainfall we've seen over the last week, and it appears that the drought busting rain will continue through the rest of this week. The latest drought map (to the left, click to enlarge) was issued last Thursday and doesn't account for the rainfall we've had since the 28th of January. While we will dry out a little today, the moisture will be on the increase beginning tomorrow and we will be back into the soupy atmosphere for Wednesday. According to the NWS, Wednesday will end up being like last Saturday in terms of being a washout and there will even be a chance for a few thundershowers, but nothing severe. The three images below show the precipitable water values for Mon-Wed. The brown and grey colors show very dry air, while the greens are very moist. You can see how our low and mid level flow starts to bring a return flow from the Gulf on Tuesday (center image) and a deeper surge for Wednesday.
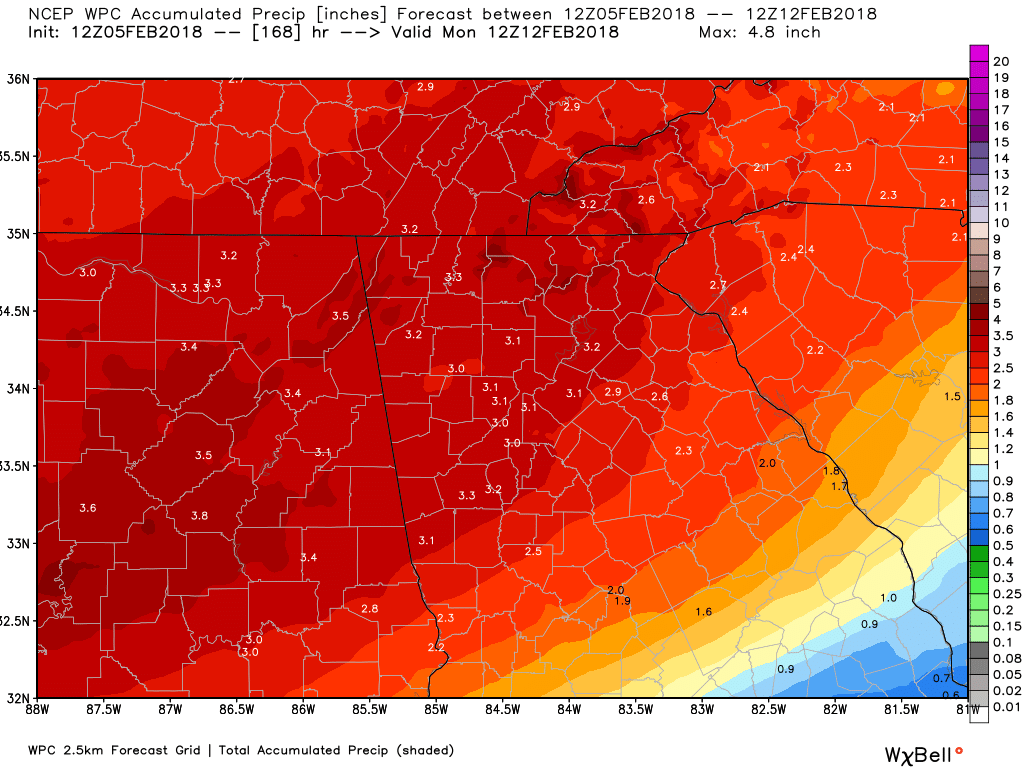
Round #1 rainfall totals are forecast to look like the left image, and then add the rainfall from system #2 from next weekend, and you get a grand total that looks like the image on the right.
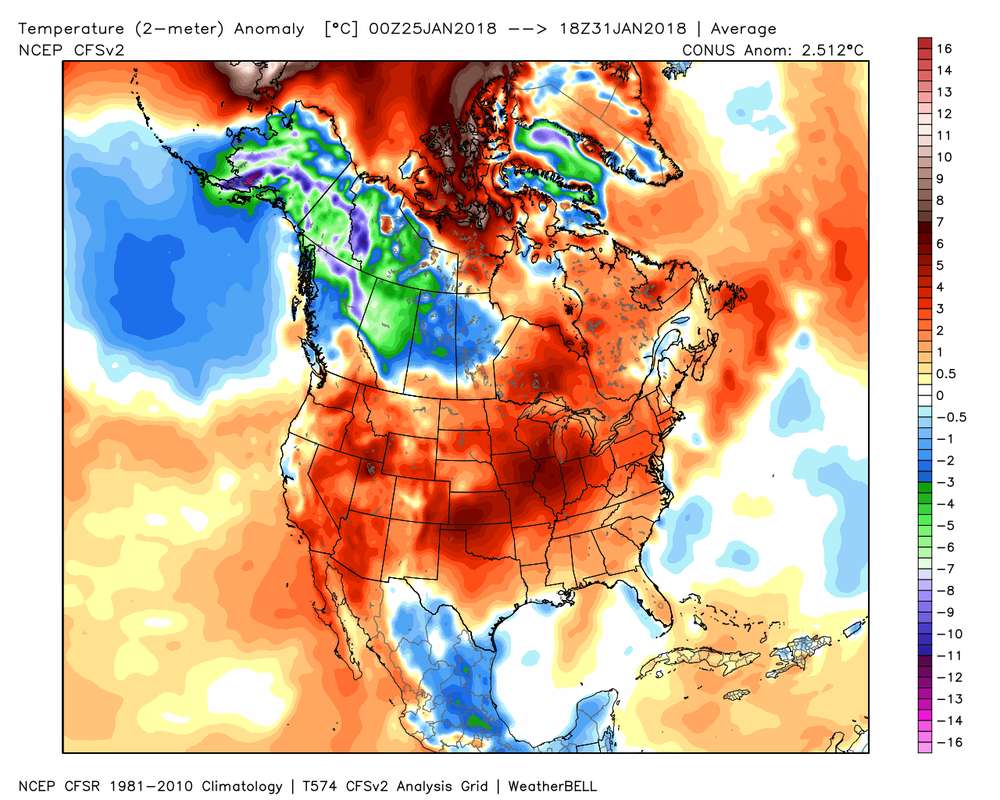
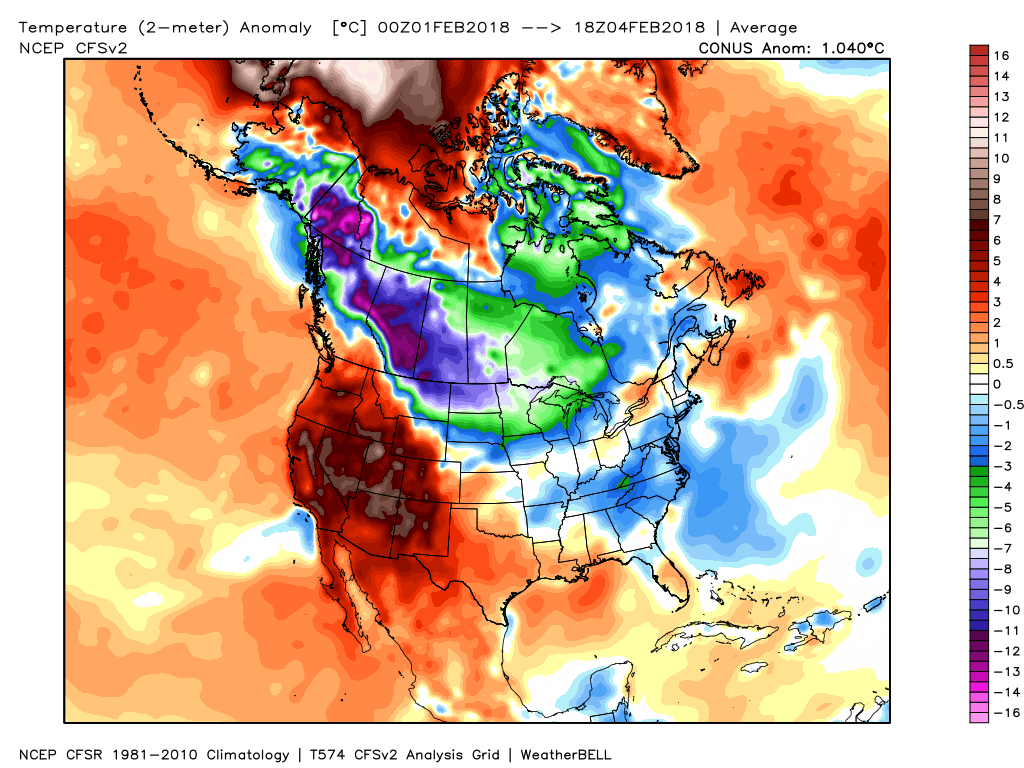
Here is the rainfall reanalysis map at a look back at the last 7 days that shows our total rainfall from 7 am Sunday, January 28th through 7 am Sunday, February 4th. 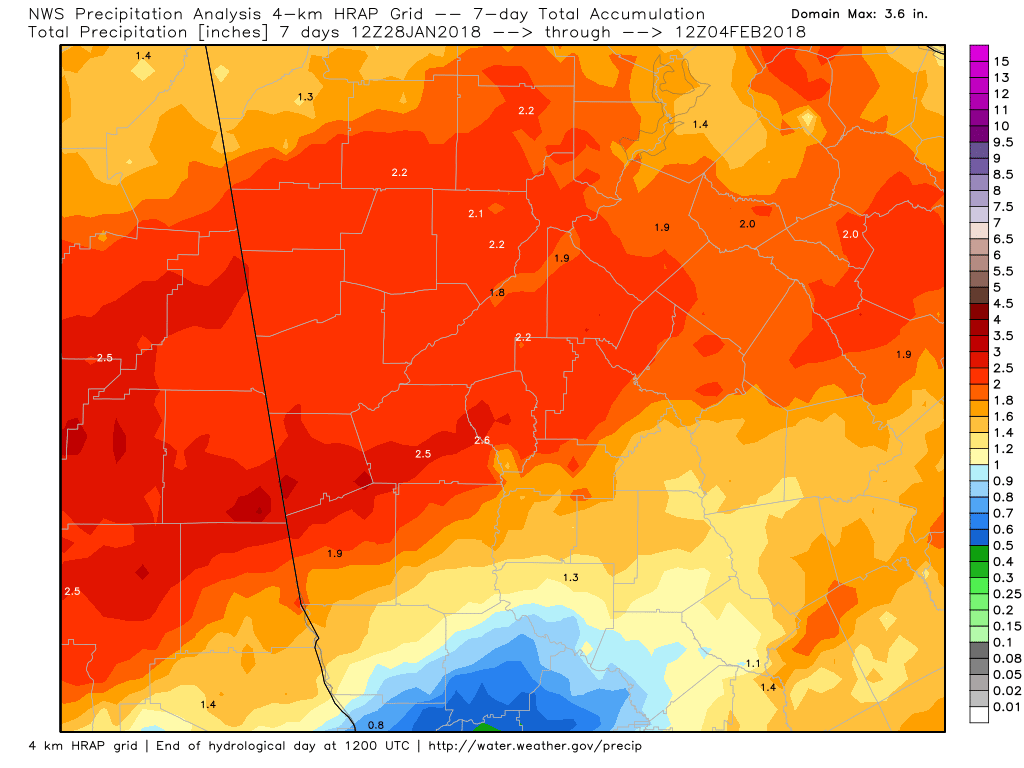 As if you didn't already know, temperatures over the last 7 days have been above normal (left image) and we expected this, so no surprises here. The image to the right is for this month so far, and you can see we've been slightly below normal. Temperatures will be running some 10-15 degrees above normal this week, so enjoy the comfortable temperatures while you can. Winter is not over by a long shot.
Here's a look at our temperatures (not anomalies) since January 1 from the Prism 4km Reanalysis.
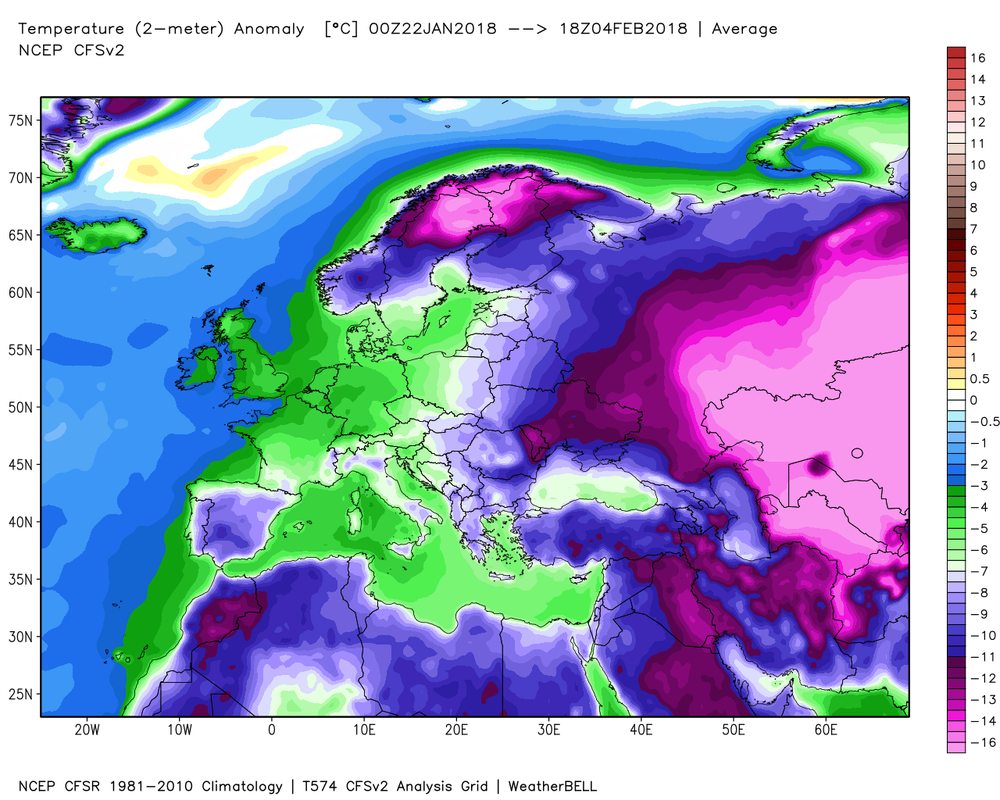
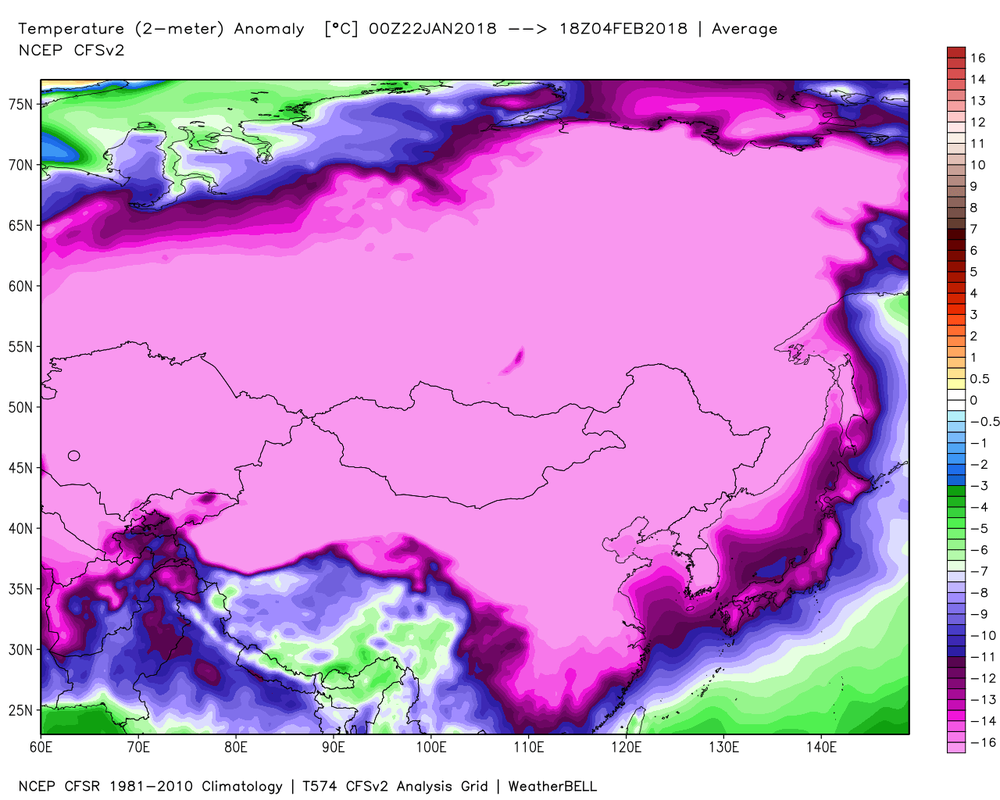
Want to see where the coldest temperature anomalies have been while we basked in mid-winter warmth? Here's a look at the past 14 day anomalies in Europe and Asia.
Here's a look at the coldest places in the Northern Hemisphere ending at 7 am this morning (Feb 5th). You can find the weather extreme's page here: www.daculaweather.com/4_world_extremes.php The page defaults to the U.S. but you can choose other regions of the world. Be patient... it takes 10 seconds or so for the script to retrieve the data. 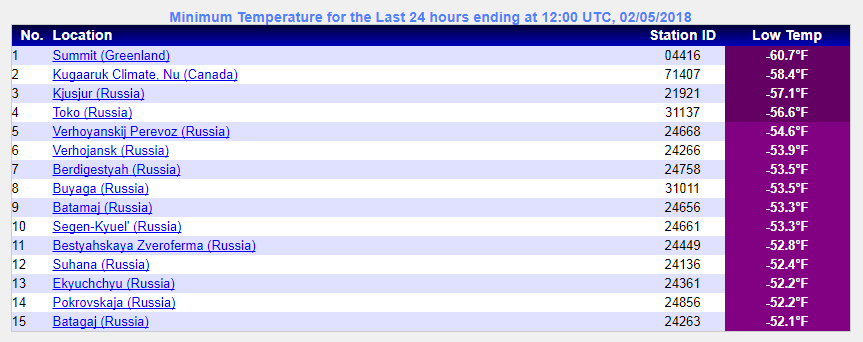 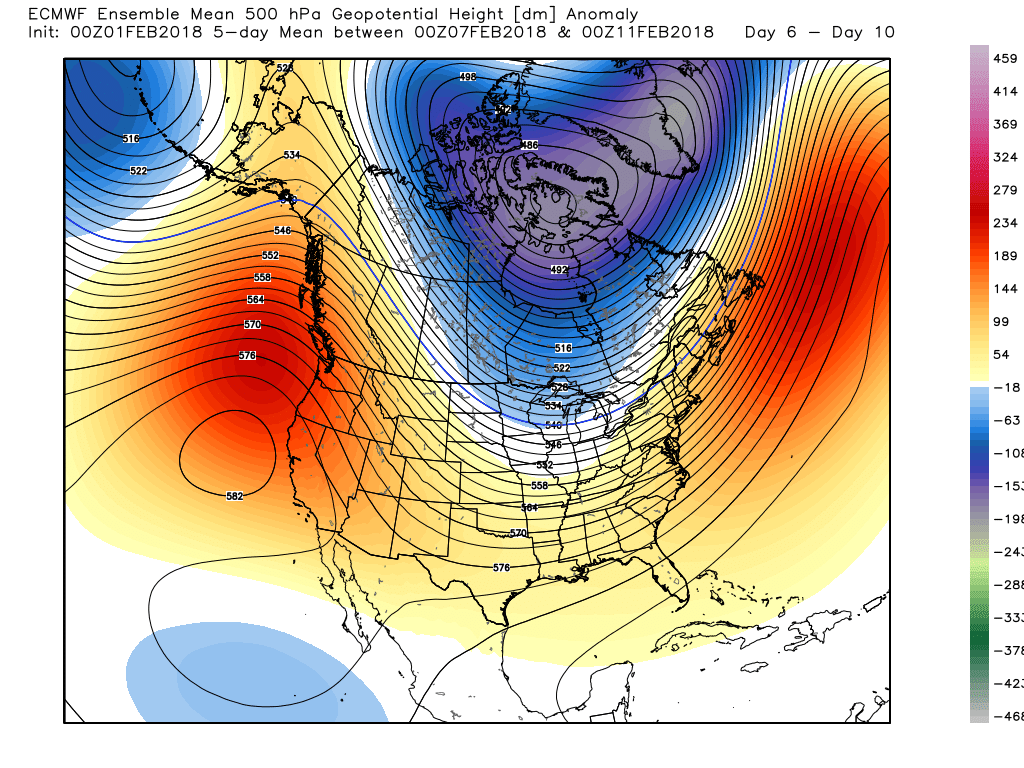
I know a lot of people are wondering if the cold is coming (not to mention any snow) so I just wanted to talk for a minute about that future.
We're watching several different events to see how they are going to effect us here in the southeast. Let's take a look. MJO - The MJO has been moving at a snails pace as it heads toward some favorable cold phases for this time of the year. The amplitude of the MJO has been pretty extreme which can help to cause wide swings in the weather. Right now the MJO is in Phase 7 which is a warm phase, but it looks like most of the models want to head into phase 8, 1, 2, 3, which are all relatively cold phases for us in February and March. However, some of the models have backed off on the strength of the MJO and even take into the neutral area, so we will need to watch to see how this progresses. MJO forecast are not the most accurate at a distance. All of the MJO maps and data can be found at this link: http://www.daculaweather.com/4_mjo_phase_forecast.php
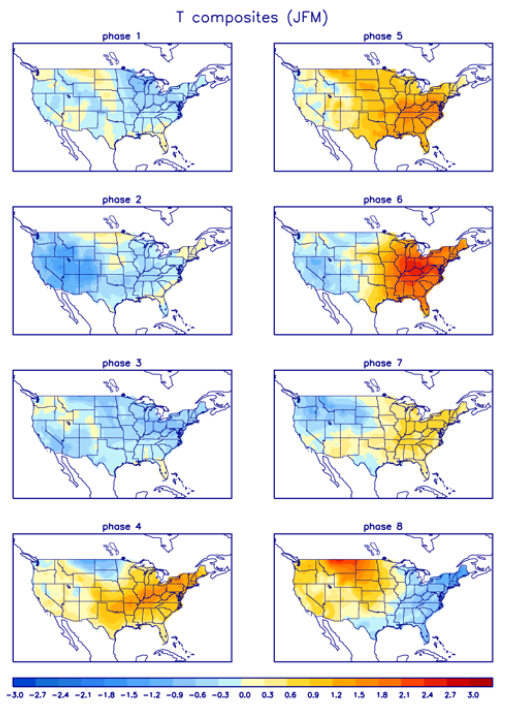
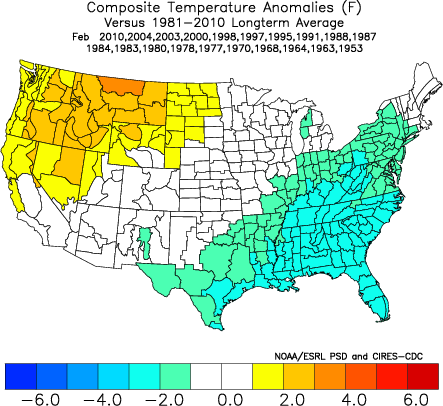
Temperature composites showing the expected temp outcome for JFM depending on the phase of the MJO
Stratosphere -
There are signs that there may be a stratospheric warming event on the horizon, and that is good news if you like the cold and want more winter. Instead of me trying to explain the complexities of a stratosphere forecast, I'll let the following Tweets speak for themselves. I have a full compliment of stratosphere maps and forecast at DaculaWeather.com. From the menu at the top, click on "Models", and then "Stratosphere Model Data".
Teleconnections -
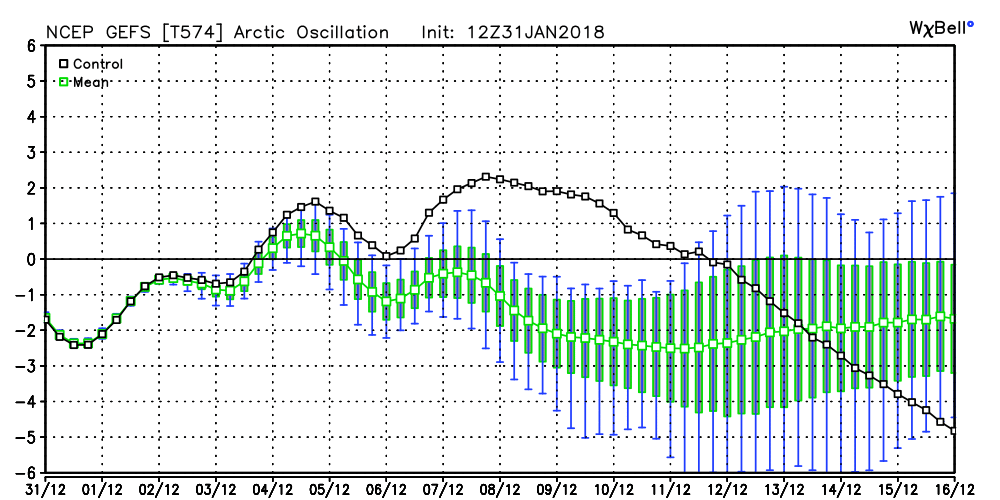
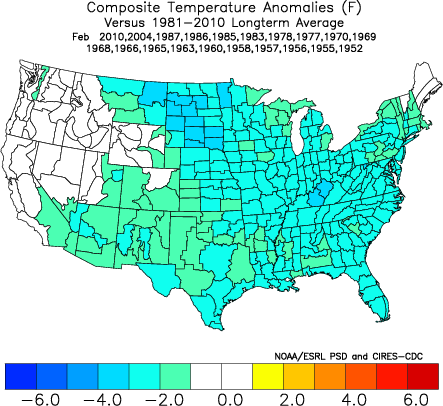
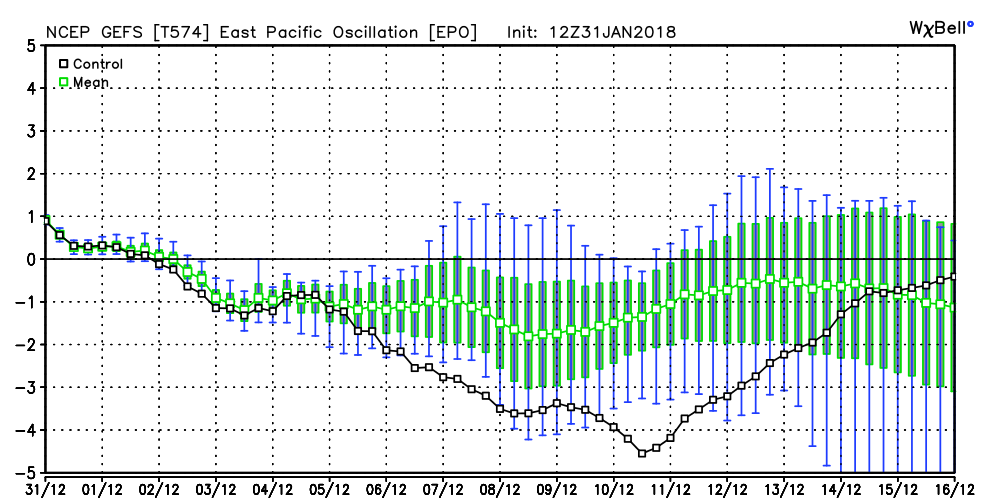
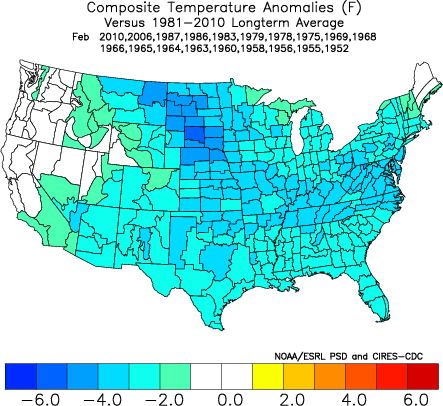
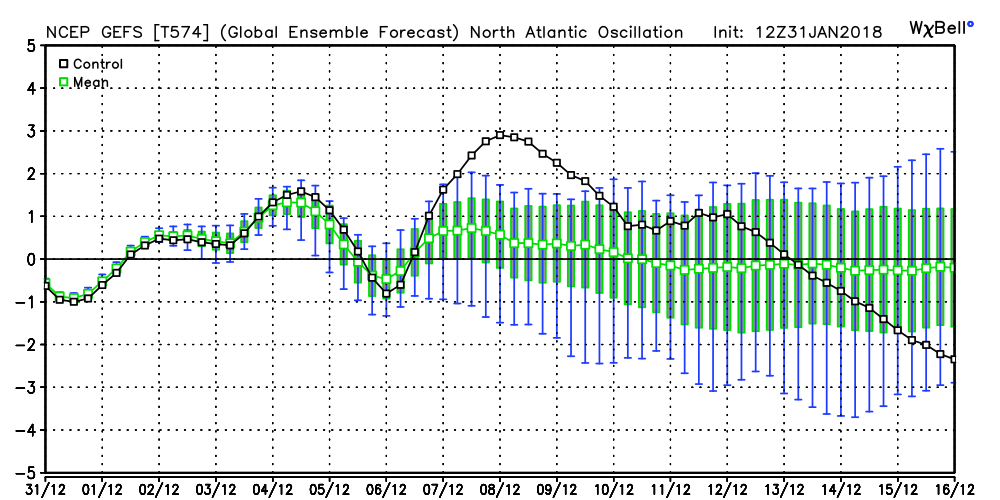
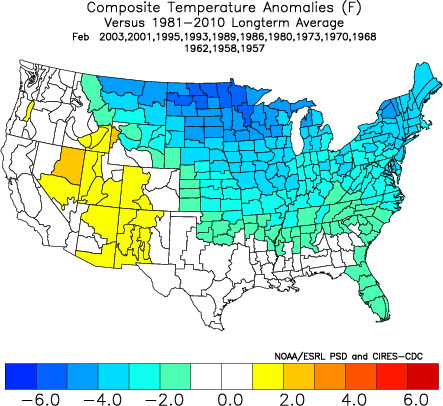
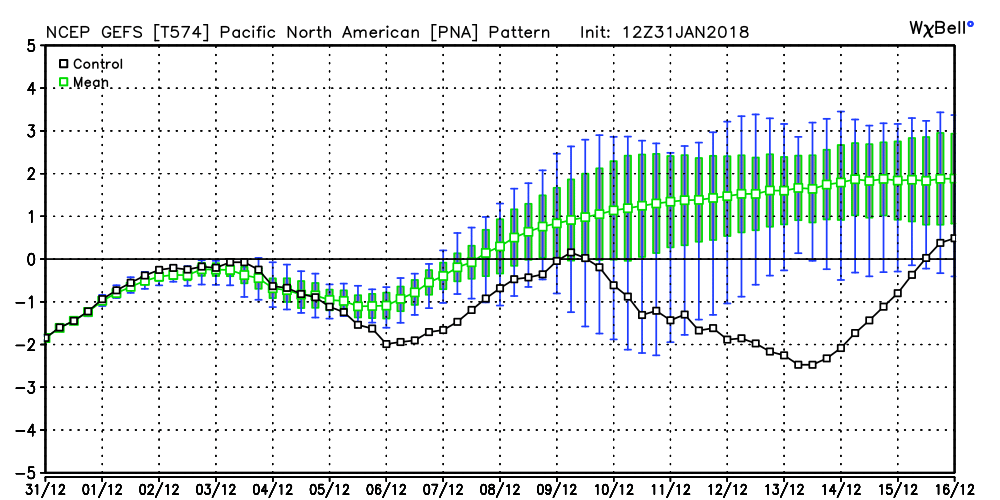
I've talked about teleconnections before, so let's talk about how the models see all of this playing out. As you may know, teleconnection indexes are simply measurements of the different patterns in the atmosphere, and during certain times of the year like in the winter, they are particularly important in defining when and where the cold air may go. The Euro has been a little indifferent in the strength of these indexes but the GFS ensemble is beginning to show some signs of major high latitude blocking. The top row of images are the current readings and the forecast, and the corresponding images in the bottom row show how the temps normally respond. The first image shows the AO going negative, the second the NAO going negative, the third image the EPO showing a tilt toward negative, and the last image is the PNA possibly heading to a positive state. You can find much more about these 4 teleconnections from the following links at http://www.daculaweather.com:
Bottom Line -
All signs are beginning to point to a change toward a cold period beginning is two weeks or less, and continuing into March. One unknown is the outcome of the stratospheric event and whether or not we can get the high latitude blocking that we need here in the southeast, and another unknown factor will be the timing of the phase and strength of the MJO. Whether or not we have precipitation to go with it is still unknown, but you can't have winter weather without cold air and it doesn't look like cold is going to be an issue. |
Archives
March 2019
Categories
All
|
OLD NORTH GA WX BLOG


 RSS Feed
|
Never base important decisions on this or any weather information obtained from the Internet. Always have a backup method of receiving weather information such as a battery powered weather radio.
Copyright © 2018 NorthGeorgiaWX.com and DaculaWeather.com 
|