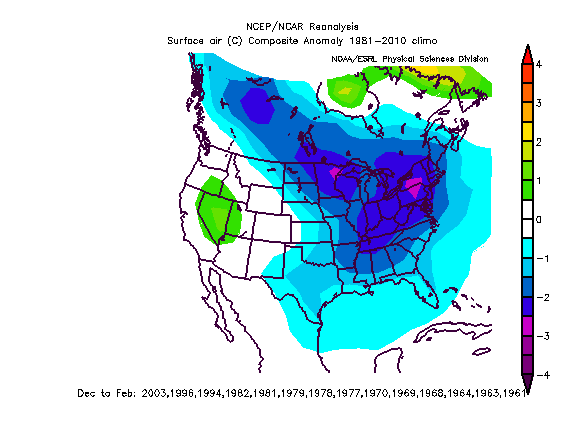
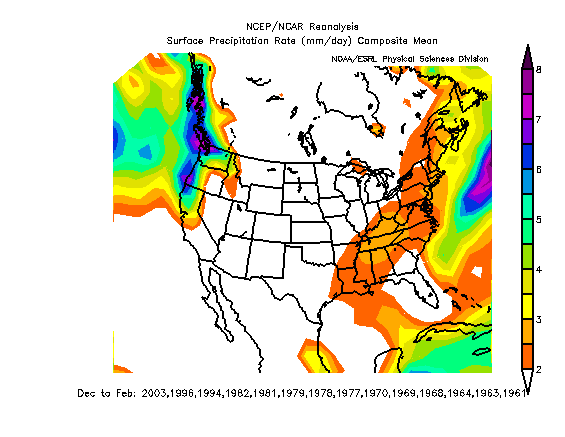
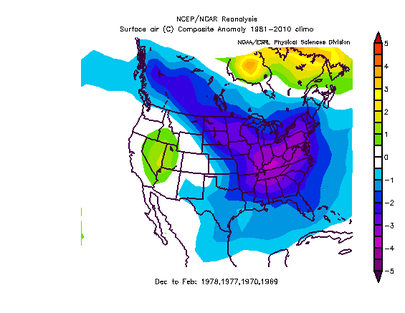
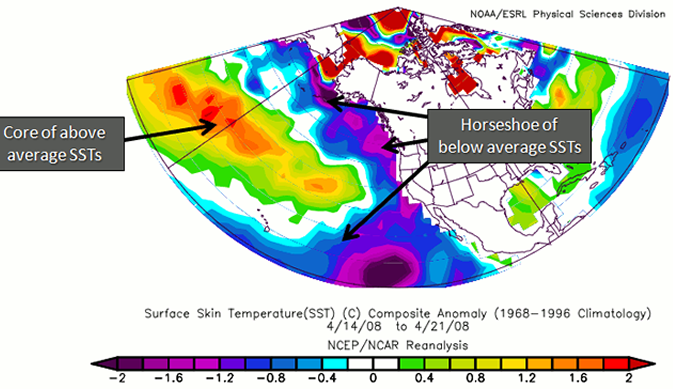
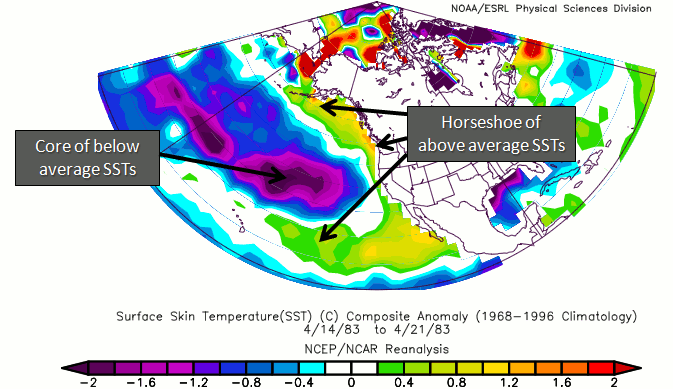
 The main focus on this article is not to make a winter forecast, but to explore what effects El Nino's and teleconnections have on winter weather across the southeast. One of the main sources of data in this report comes from a weather friend of mine that I call "Brother Larry". Larry would prefer to remain anonymous, so from here on out you'll hear me refer to Larry as "Brother Larry". :-) Larry has a wealth of information about the weather history in Georgia, and I'll be using a lot of his findings to help give you an idea how this winter may turn out, based on the environment created by the El Nino, as well as several other factors. Again, this data is based on analog years, or those years that most closely identify with the current patterns, so keep that in mind. Analog's are not perfect, but they do give us a very good idea about how things have happened in the past and how they may happen again in the future. Again, almost all of the text below (other than a few of my own edits and additions) is from Larry, and he gets all the credit for the research and stats. ENSO and Southeast US WintersThis data was compiled by taking a list of 26 “cold” US winters (Dec/Jan/Feb) since 1894 -1895 (i.e., the coldest 23%) for the eastern third of the US. This requires solid, widespread, below normal anomalies, and requires the southeast to be pretty chilly itself. The two maps to the right were created with data from the list of years below, but that dataset only goes back to 1948, so the maps I'm displaying are not 100% complete with the years in the list. Here's the list of those winters, and you can see the years I used on the maps themselves. Also, Larry's 26 coldest winters study was done the better part of 10 years back, since then, it is possible that some of 09, 10, 13, 14, etc. could be added, although he is not reassessing those now.
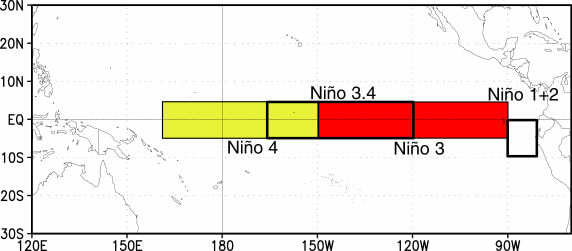
Nino Base State
Nino and the Pacific Decadal Oscillation (PDO)
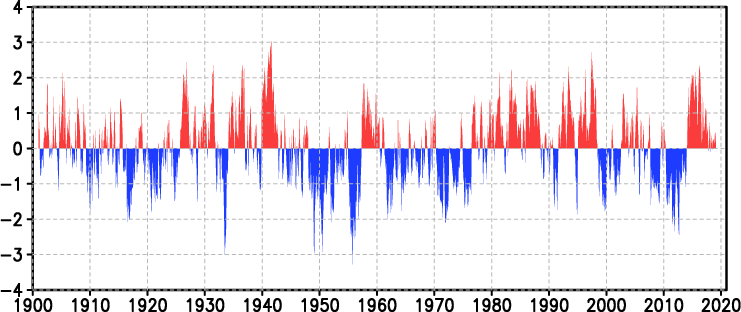 PDO Index (http://www.daculaweather.com/4_pdo_index.php) PDO Index (http://www.daculaweather.com/4_pdo_index.php) While it's easy to look at one specific weather pattern, there are many factors that determine how a winter will turn out, with the ENSO state being just one of those. But there are other teleconnections and long term patterns that also have an effect on our winter weather, and they all work in tandem with each other. Graphs and Charts Now we are going to turn our attention to the PDO state or Pacific Decadal Oscillation. First, the definition from the National Center for Environmental Information: "The Pacific Decadal Oscillation (PDO) is often described as a long-lived El Niño-like pattern of Pacific climate variability (Zhang et al. 1997). As seen with the better-known El Niño/Southern Oscillation (ENSO), extremes in the PDO pattern are marked by widespread variations in the Pacific Basin and the North American climate. In parallel with the ENSO phenomenon, the extreme phases of the PDO have been classified as being either warm or cool, as defined by ocean temperature anomalies in the northeast and tropical Pacific Ocean. When SSTs are anomalously cool in the interior North Pacific and warm along the Pacific Coast, and when sea level pressures are below average over the North Pacific, the PDO has a positive value. When the climate anomaly patterns are reversed, with warm SST anomalies in the interior and cool SST anomalies along the North American coast, or above average sea level pressures over the North Pacific, the PDO has a negative value (Courtesy of Mantua, 1999). " Here's an analysis of the cold 26 winters by DJF averaged PDO status:
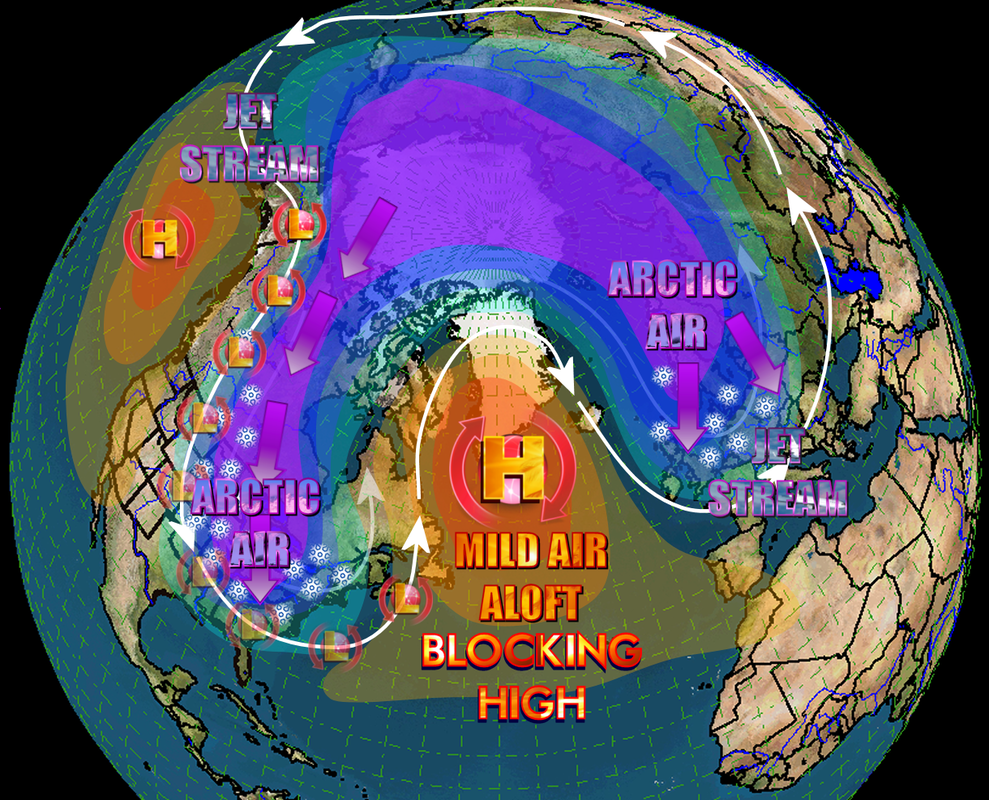
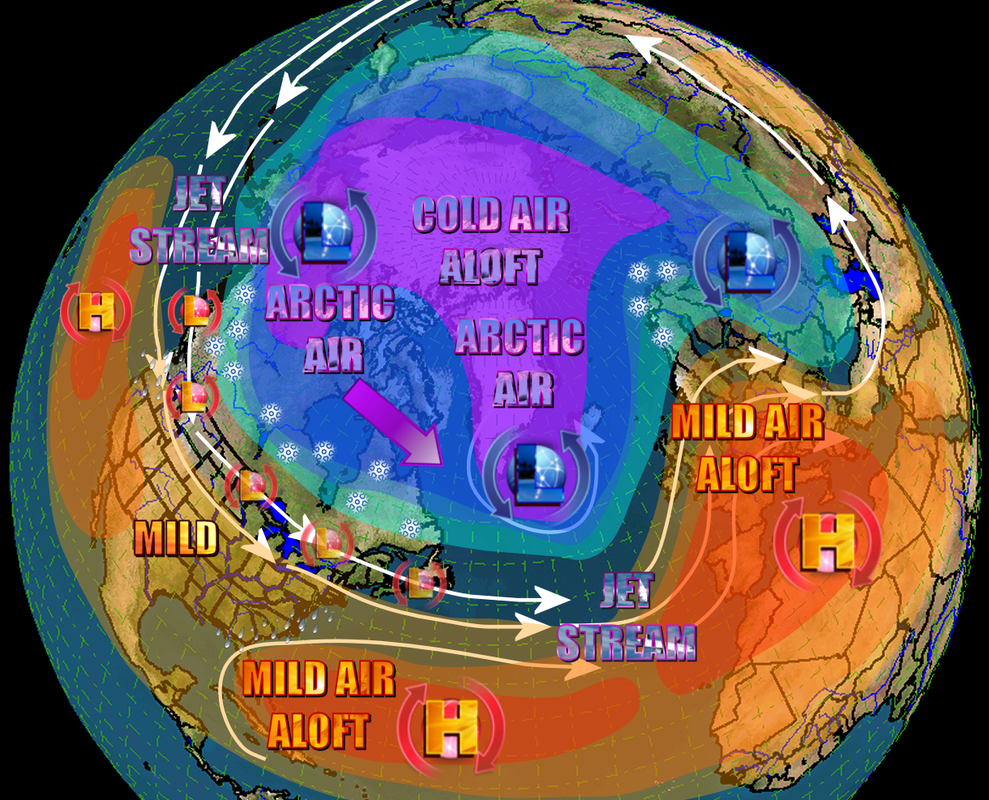
Nino and the North Atlantic Oscillation (NAO)In order for us to get long lasting cold air that stays locked in, we need some blocking. There are several teleconnection patterns that aid in developing this blocking, one of which is the North Atlantic Oscillation or NAO. Graphs and Charts
Here's the definition of the NAO: "The North Atlantic Oscillation (NAO) is a climatic phenomenon in the North Atlantic Ocean of fluctuations in the difference of atmospheric pressure at sea level between the Icelandic low and the Azores high. Through fluctuations in the strength of the Icelandic low and the Azores high, it controls the strength and direction of westerly winds and storm tracks across the North Atlantic. It is part of the Arctic Oscillation, and varies over time with no particular periodicity." Strong positive phases of the NAO tend to be associated with above-average temperatures in the eastern United States and across northern Europe and below-average temperatures in Greenland and oftentimes across southern Europe and the Middle East. They are also associated with above-average precipitation over northern Europe and Scandinavia in winter, and below-average precipitation over southern and central Europe. Opposite patterns of temperature and precipitation anomalies are typically observed during strong negative phases of the NAO. For us, negative is what we're looking for in the winter. Let's take a look at the analysis of the cold 26 Dec-Feb winters by averaged NAO status:
Piecing It All Together...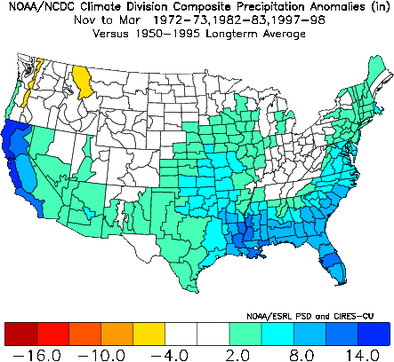 Now let's take the combination of the ENSO state (in our case, Nino), and factor in the PDO and NAO and let's see what we get. Here's the analysis of the 26 cold winters by a combination of Dec-Feb averaged PDO and NAO status:
Now, let's really lay it out. Here's "Brother Larry's" analysis of the 26 cold winters by a combination of ENSO state and Dec-Feb averaged PDO and NAO status: Strong Nino:
Moderate Nino:
Weak Nino:
Neutral Positive:
Neutral Negative:
Weak Nina:
Moderate Nina:
Strong Nina:
Conclusions...
Winter PrecipitationRegarding wintry precipitation for Atlanta, when looking at the three standalone super Nino's (1972-1973, 1982 -1983, 1997-1998) as well as the six strong to super strong 2nd year Nino's (1877-1888, 1888-1889, 1896-1887, 1905-1906, 1940-1941, 1987-1988), Atlanta more often than not, had one major winter storm, but not always:
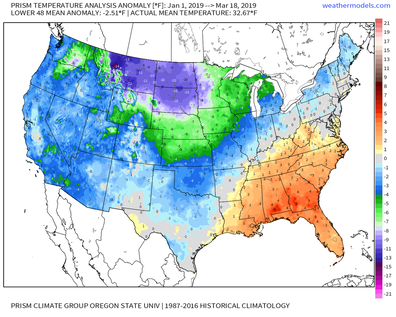
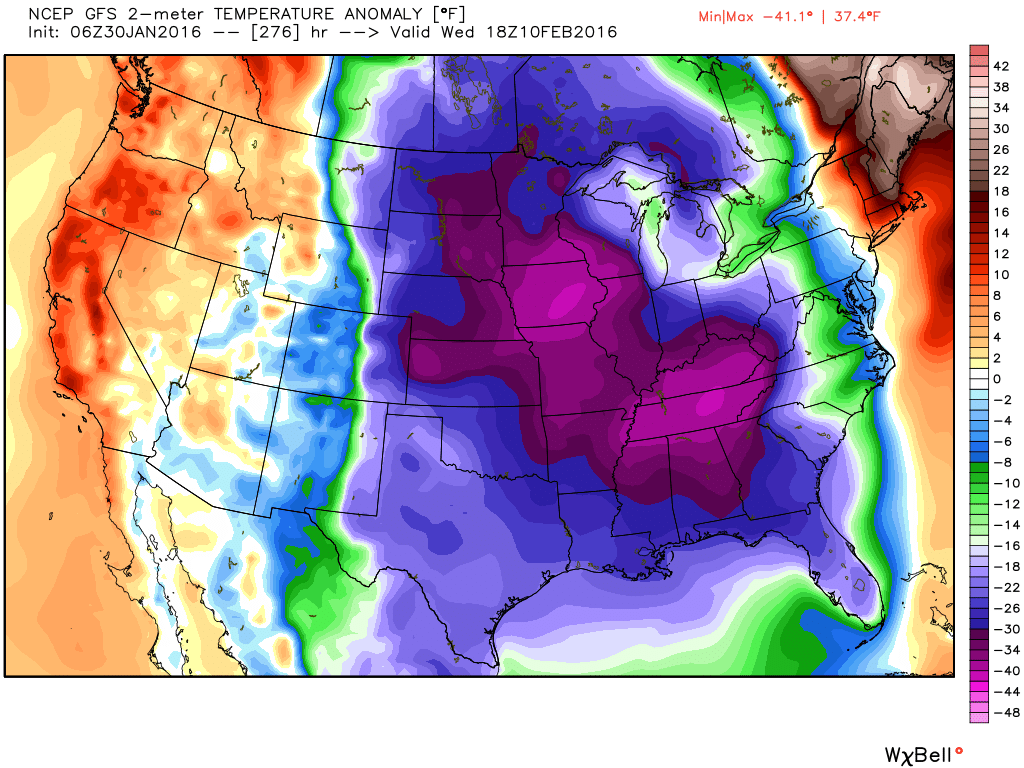
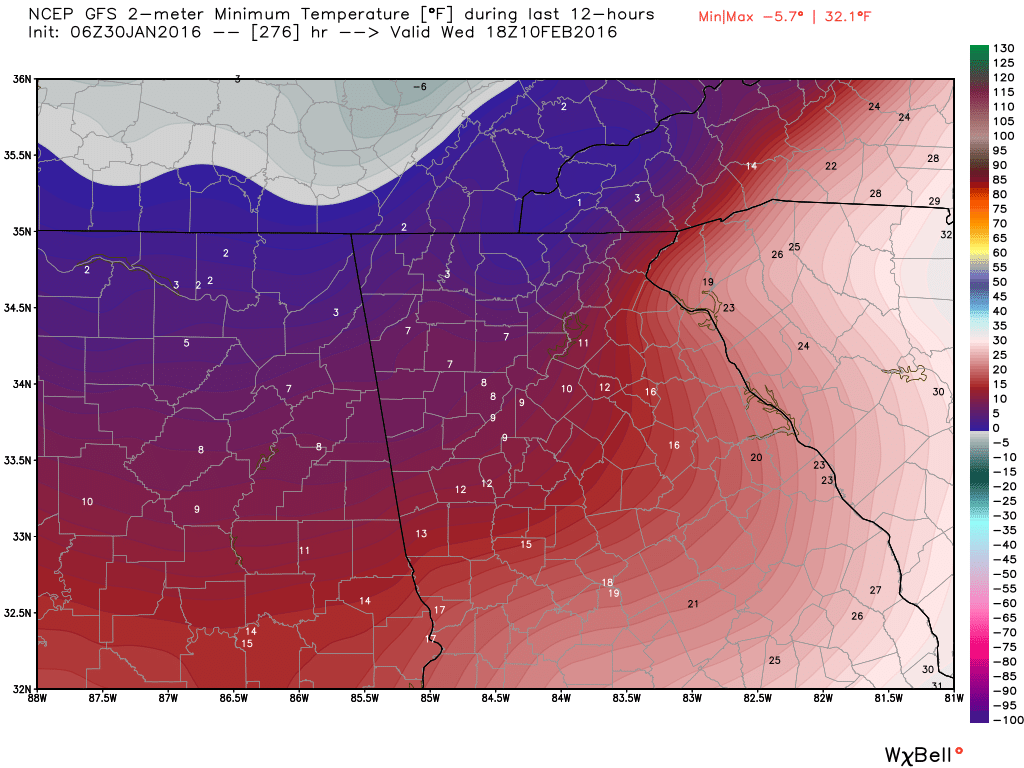
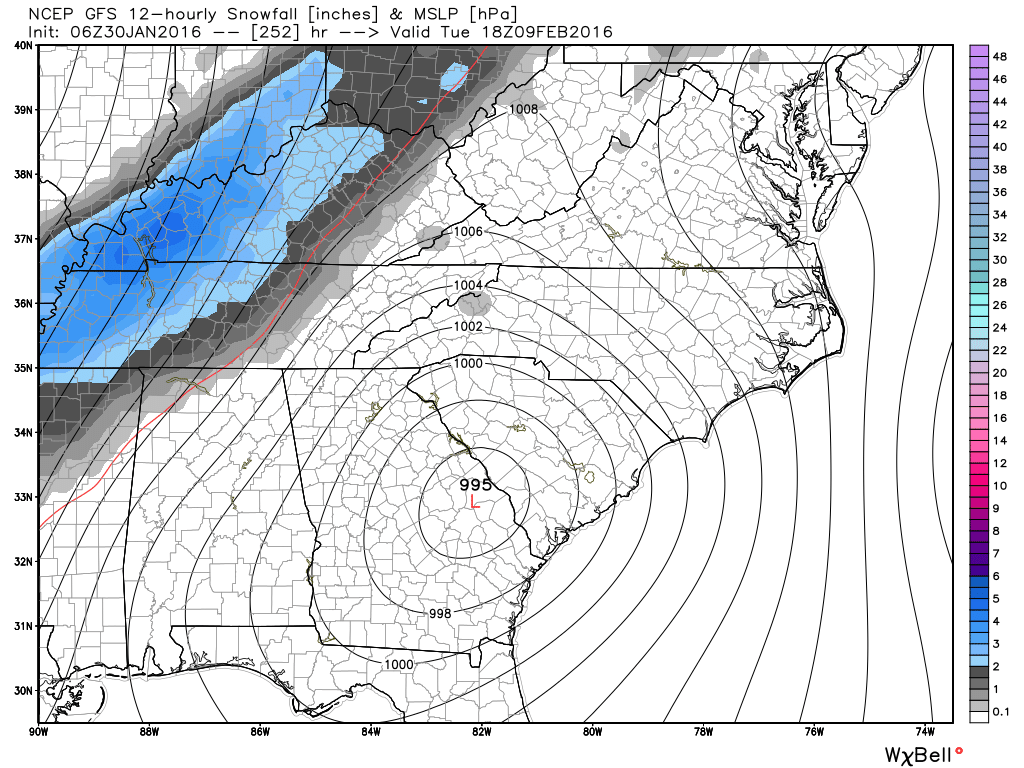
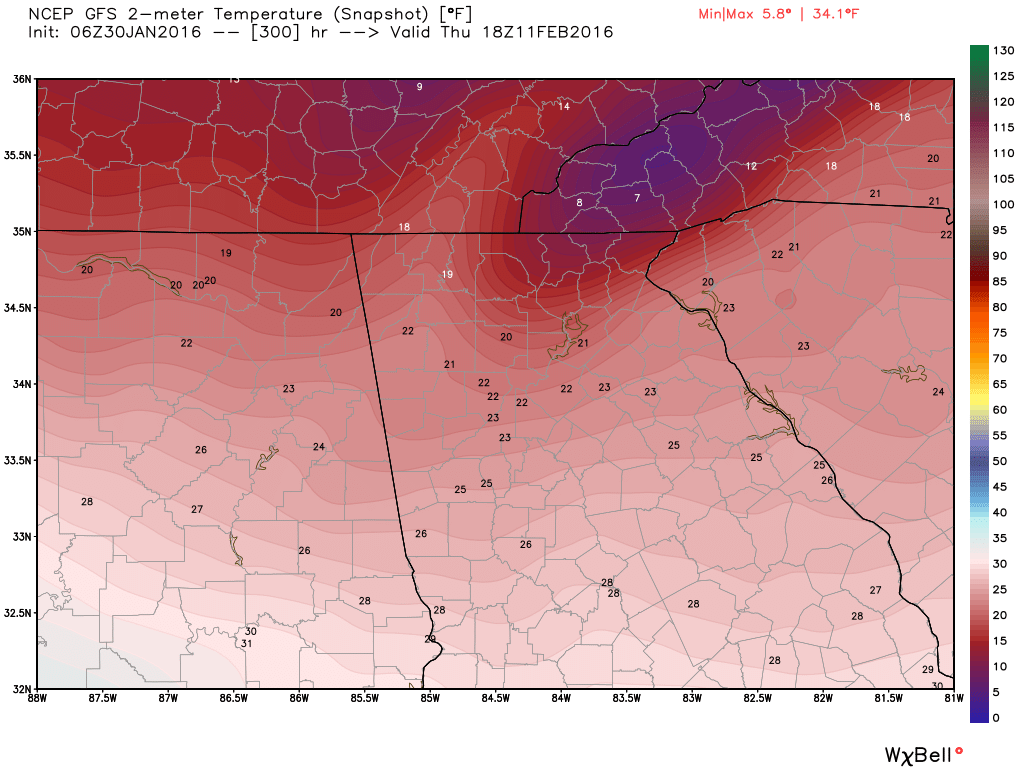
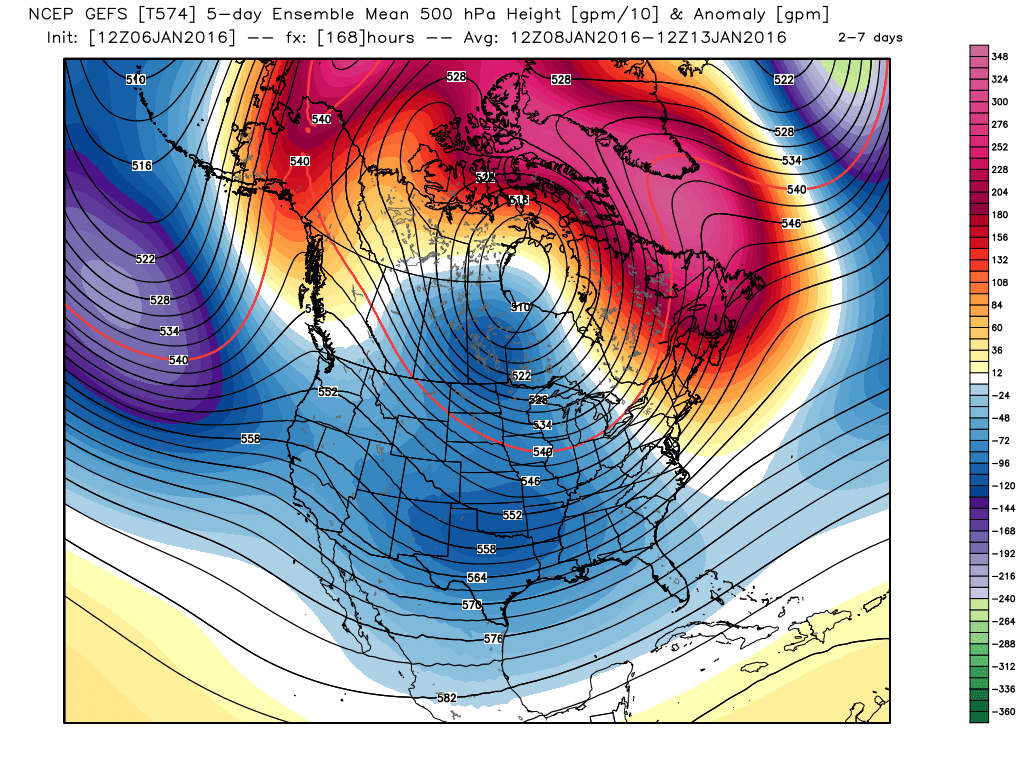
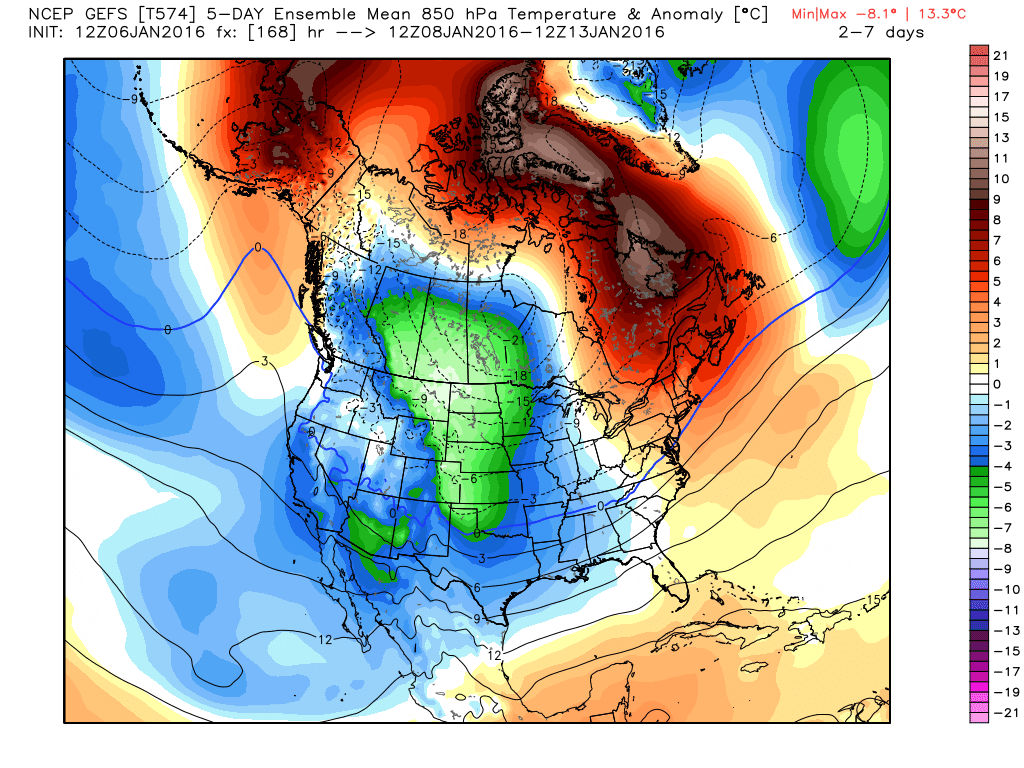
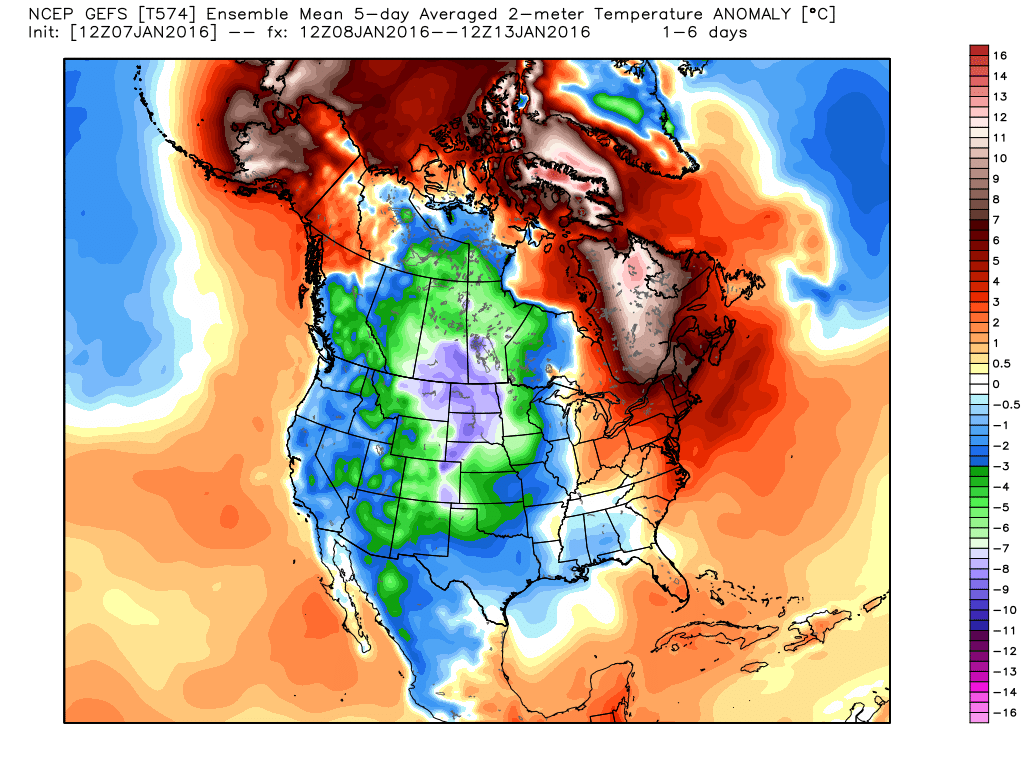
I started looking at the computer models this morning, and I usually look at the GFS first since it appears first in the list of modes on the WeatherBELL site. I got out to around day 10-11 and and my jaw hit the floor. The GFS was bringing the whole arctic into the US. The images are explained below, but what the GFS is showing are temperatures 40-50 degrees below normal. Lows in north Georgia would be in the single digits if not lower, and highs would struggle to get above 20. But.... there is a possibility of a big storm during that period. THIS is the storm and period we can't afford to miss out on, so we'll wait and see if the low takes a more southern track. There is a lot of time for this pattern to evolve but it appears to be a prime period for winter weather. Just a reminder that these images are not a forecast, but one model run from one model. But we are certainly headed the correct direction for winter weather.
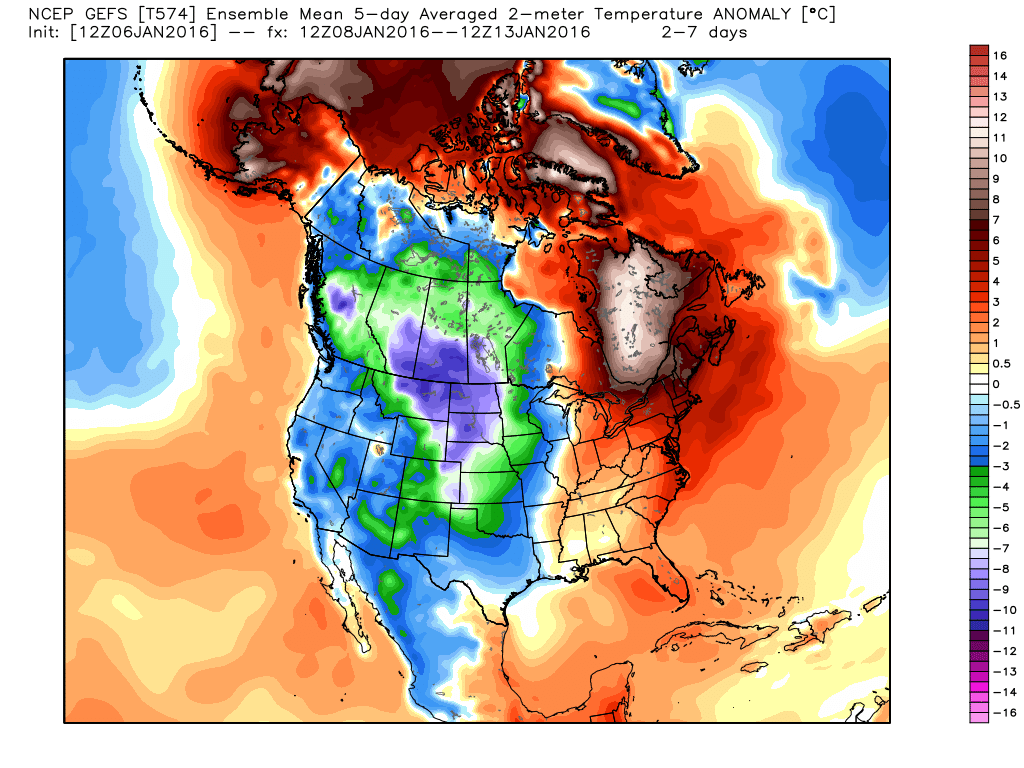
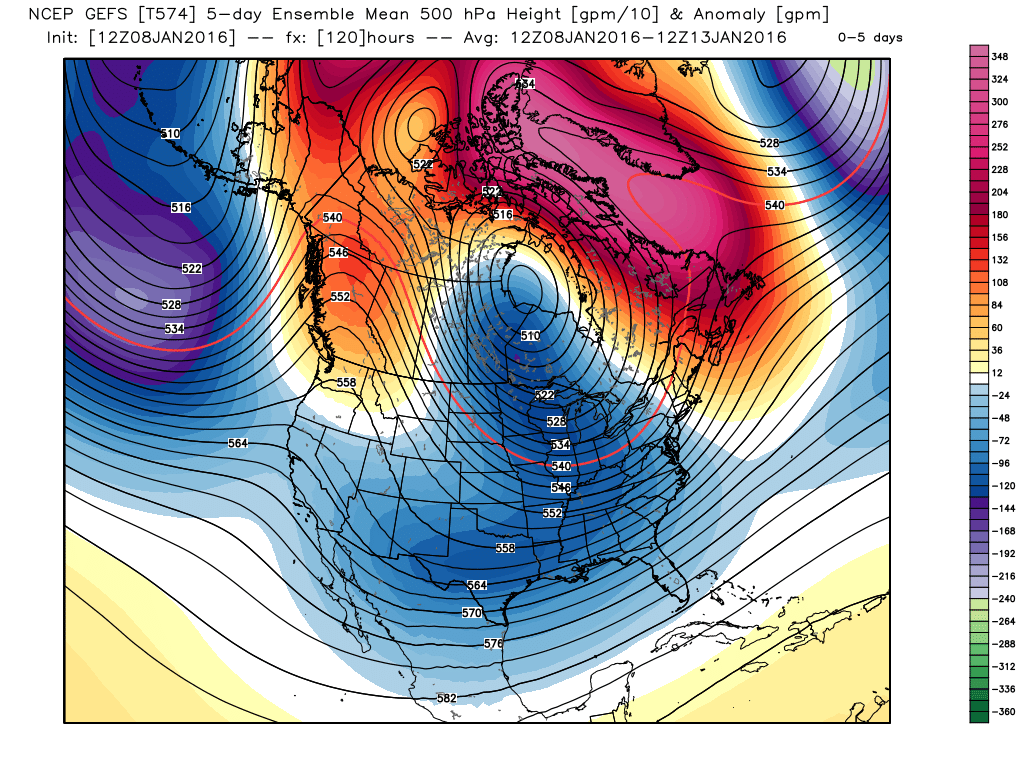
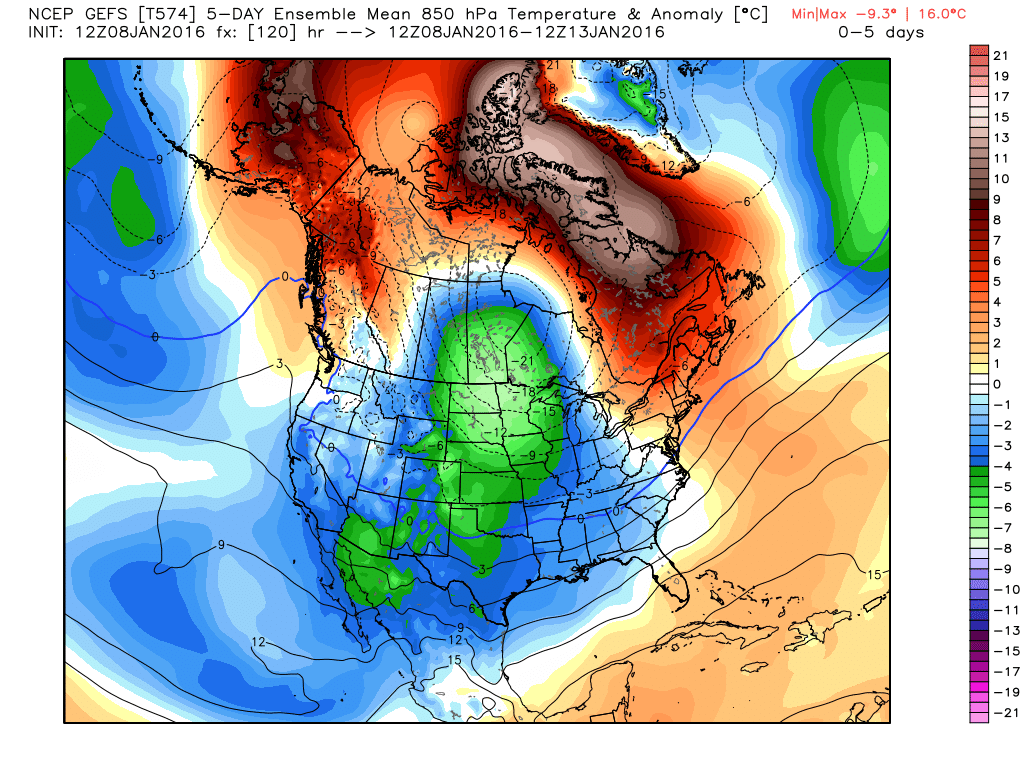
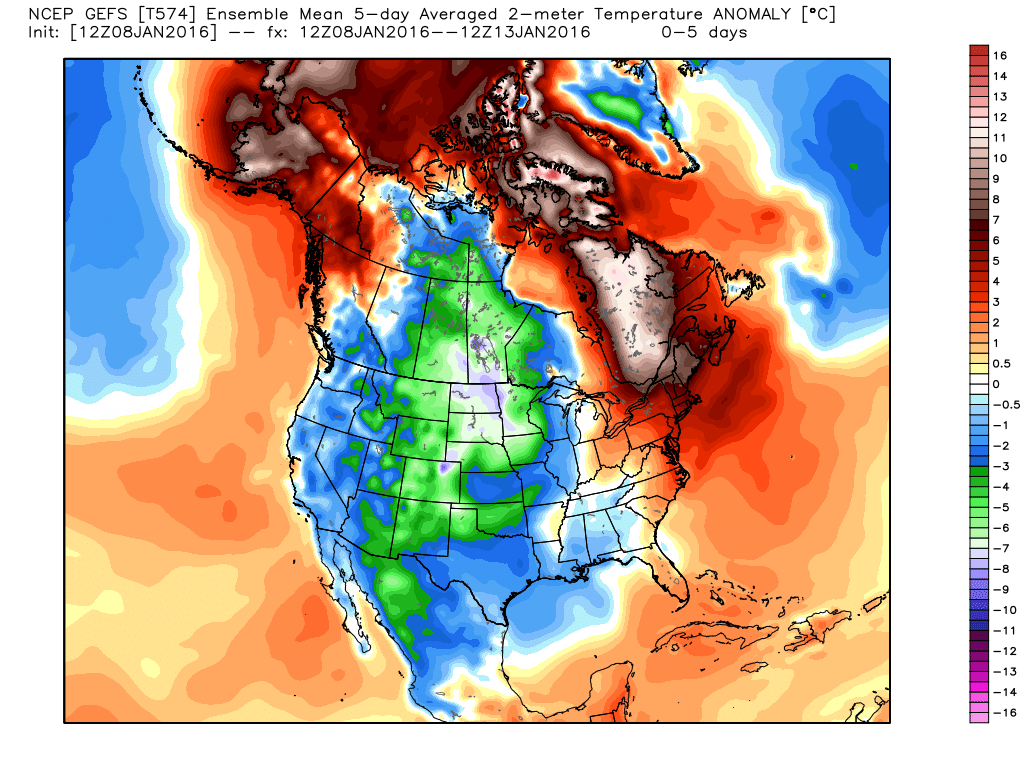
EDIT: In my total lack of foresight (read that as very little thought), I failed to remember I was looking at 5 day averages.... therefore this test is over. On to a new one. I thought I'd run a little test to find out how reliable the new GFS Ensembles are this winter, so I'm collecting maps beginning 7 days out. I have the temp anomalies, 850 temp anomalies, and 500 mb anomalies, all 5 day averages for the period from the 8th through the 13th. Because they are 5 day averages, the changes "should" be slow to show up. I'll be adding to this daily, and the next go around I'll be looking at the operational runs as well to see how those compare. These start with the 12Z runs from today, Thursday, January 7th. 7 Days
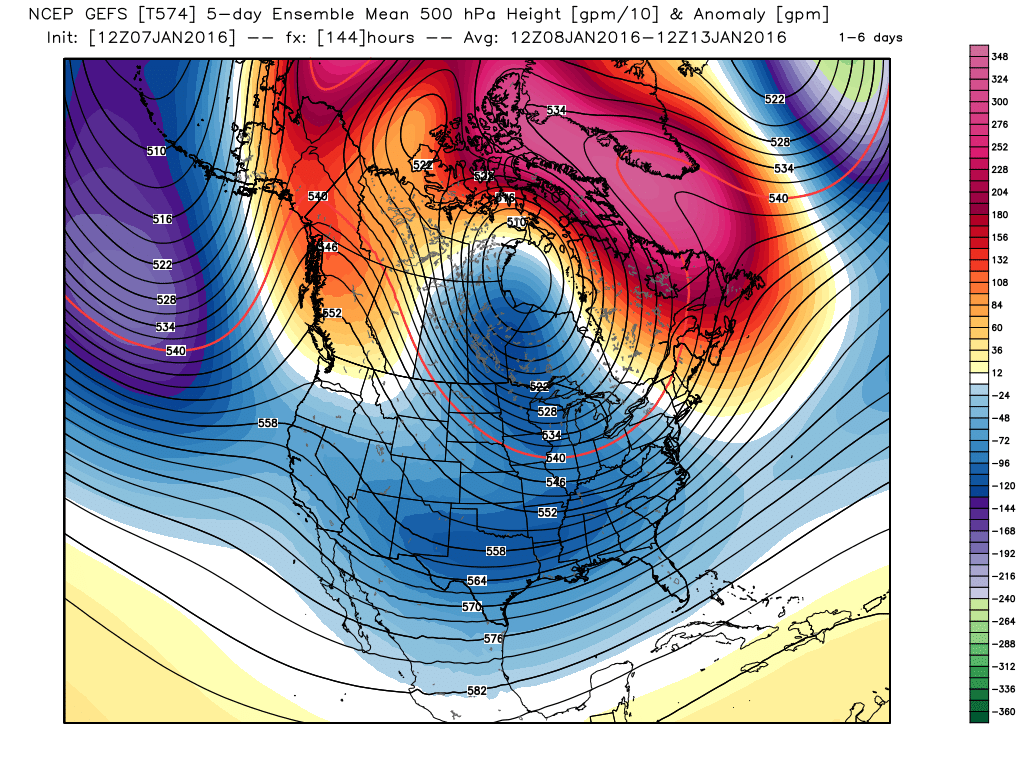
6 Days
5 Days
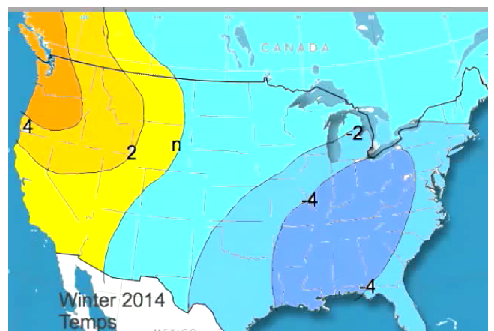
EDIT: I will be adding additional information to the bottom of this post until I do the next one around October 1. Please check back for updates, I'm sure they will be frequent! As we approach meteorological fall (September 1), I thought it would be a good time to take a long range look at our potential for winter weather for this upcoming 2014-2015 winter season. I'm ready for winter, so I had to share what we currently believe may happen. The outlook is based on the factors that are currently in place, and/or expected to be in place by the time winter arrives. Keep in mind, no one has that crystal ball that will tell us what's going to happen this winter (although if you know of one for cheap, I'm in the market... :-)), but if we take the time to look at similar weather patterns from the past, we can use those analogs to help to predict what may be in store for us in the future. One of my weather buddies is a weather statistician, particularly regarding Georgia weather. But Larry (aka "Brother Larry" if you've followed my past Patch.com blog) also keeps stats on Nina/Nino events as well as other types of weather information, and has been spot on in the past about statistically analyzing past winter weather seasons and providing probabilities for future events. Fun stuff! Larry has graciously allowed me to quote him about some of the statistical probabilities for the weather this winter in the Atlanta area, so many thanks to Larry and his hard work putting these statistics together. In Larry's post, he makes reference to several teleconnection indices as well as the ENSO status. Here are some links to those indices that will help you better understand what he's talking about. Click on a specific bullet item for further information:  Nino3.4 Forecast  PDO (Pacific Decadal Oscillation) 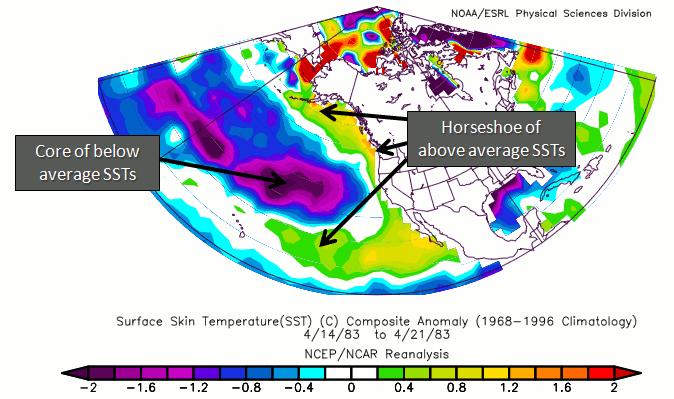 +PDO anomalies Right now, the highly touted "Super Nino" that many expected to materialize, has not happened and doesn't appear likely to happen. It now appears that a weak to neutral Nino may occur in it's place. Typically, weak El Nino's have brought great winter weather to the southeast (great meaning if you like winter weather!), and I have more on that below in Larry's post. The PDO has been in a positive phase for the first 6 months of this year, and a +PDO (plus weak Nino) is what we want for winter weather here in the southeast. Note that with a +PDO, or positive phase, the "wintertime Aleutian low is deepened and shifted southward, warm/humid air is advected along the North American west coast and temperatures are higher than usual from the Pacific Northwest to Alaska but below normal in Mexico and the Southeastern United States. Winter precipitations are higher than usual in the Alaska Coast Range, Mexico and the Southwestern United States but reduced over Canada, Eastern Siberia and Australia". Keep in mind that a strong Nino would reduce precipitation here, but a weak one actually increase our chances for winter weather. Keep these facts in mind as you read Larry's post. Larry's Winter Weather Statistics for Atlanta...In his free video from this weekend (click on the link below), Joe Bastardi shows a map with a prediction from WeatherBell.com of a very cold Southeast winter. He has much of the SE US near or even colder than 4 F below normal. In all of the years of following JB, I can't recall a forecast quite that cold for the SE. However, IF there really ends up being a weak Nino fall/winter peak, a +PDO, and a -NAO, I could see this or even colder than this actually happen. Perhaps he is already thinking somewhat along those lines.
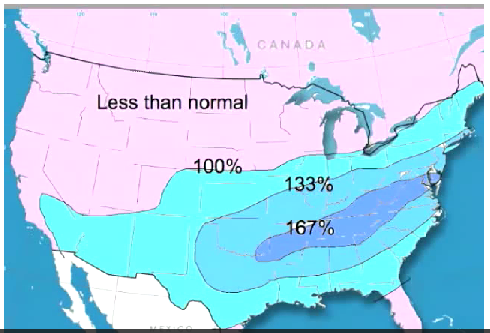
You can see from Larry's post, it's not any one factor that determines what the winter is going to be like, it's the interaction between all of the different teleconnections (and a little luck) that determines what happens. So for now, it looks like a possibility of below normal winter temperatures with normal to above normal winter precipitation for the Atlanta metro area. All of this is dependent on the strength of the Nino during the fall and winter season, so as we get closer to winter, I'll have several additional blog post about how all of this is playing out. Look for another one around October 1 and again right around November 1. ----------------------------- UPDATE - 08/17/14
|
Archives
March 2019
Categories
All
|
OLD NORTH GA WX BLOG

 RSS Feed
|
Never base important decisions on this or any weather information obtained from the Internet. Always have a backup method of receiving weather information such as a battery powered weather radio.
Copyright © 2018 NorthGeorgiaWX.com and DaculaWeather.com 
|