|
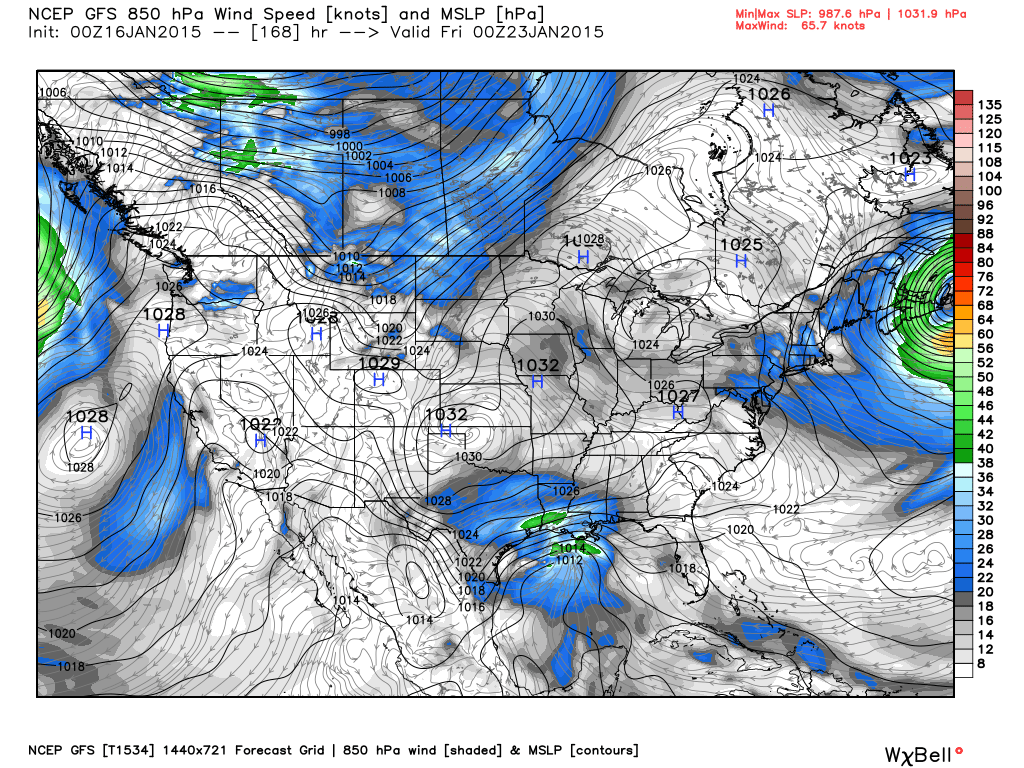
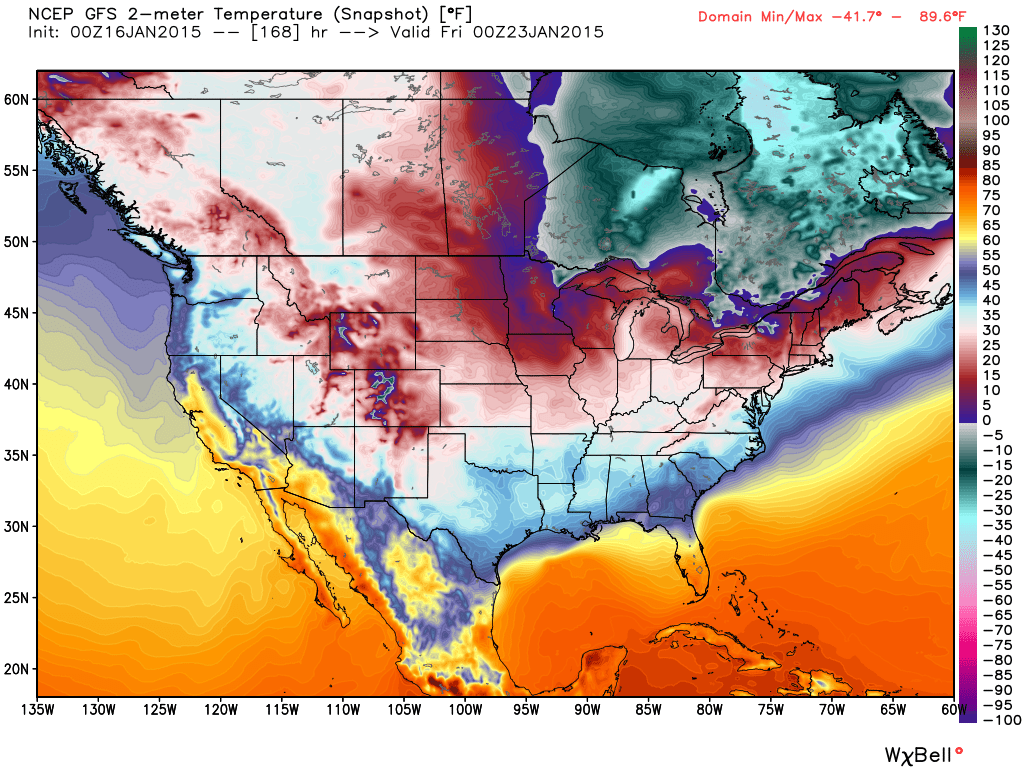
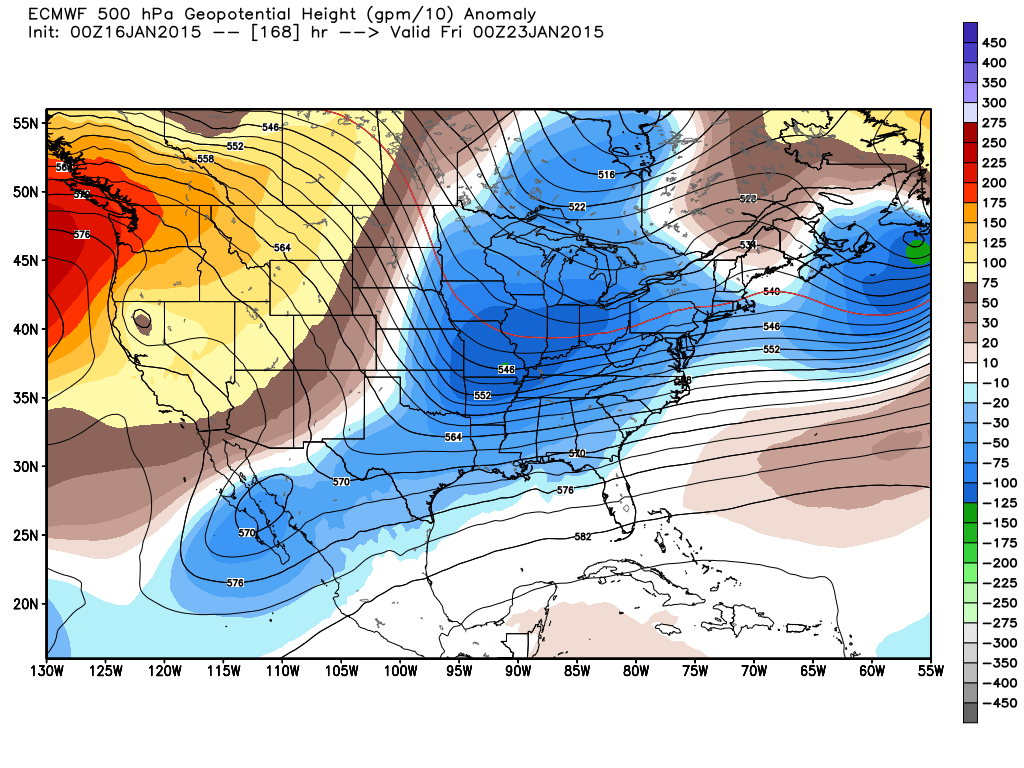
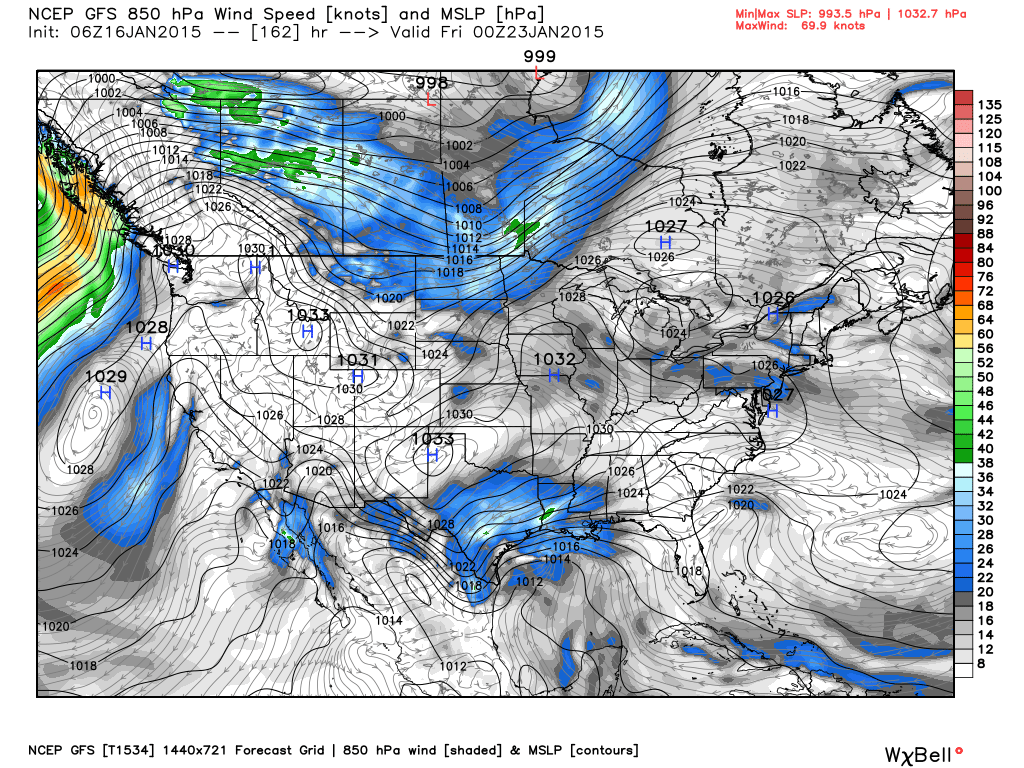
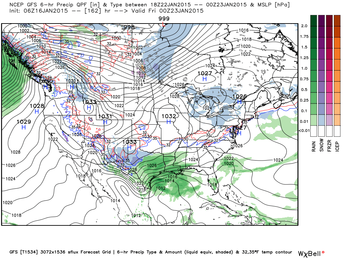
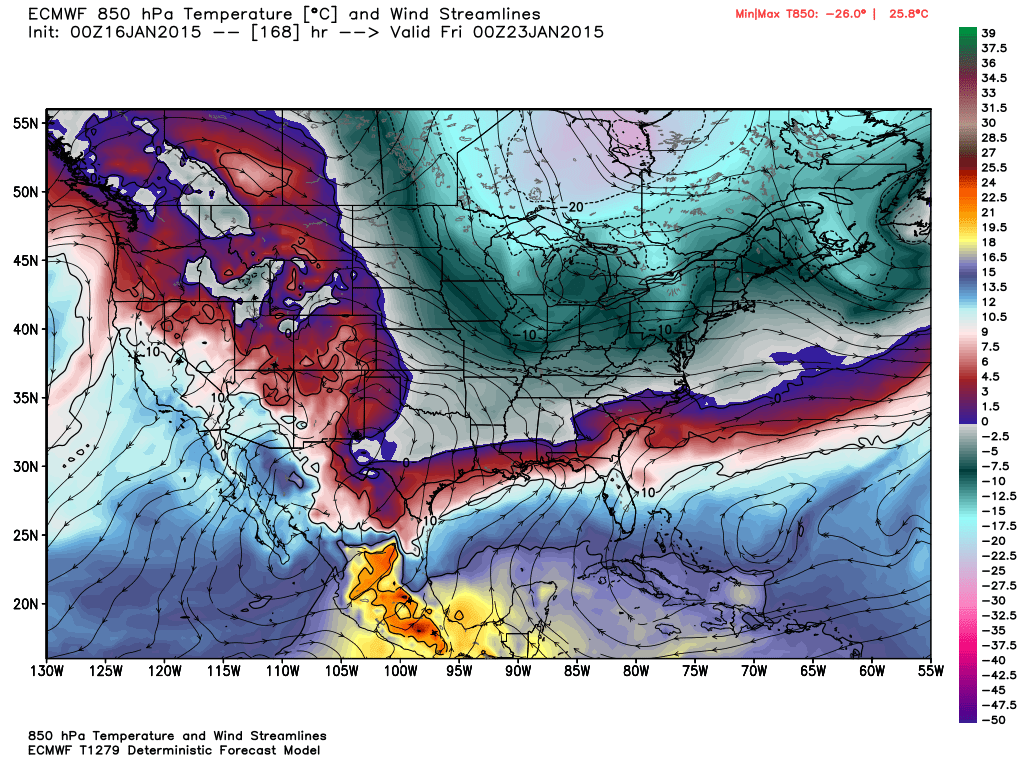
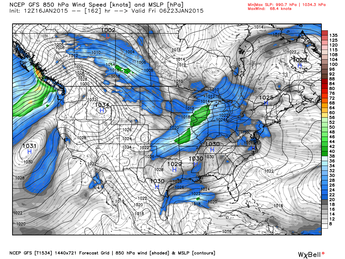
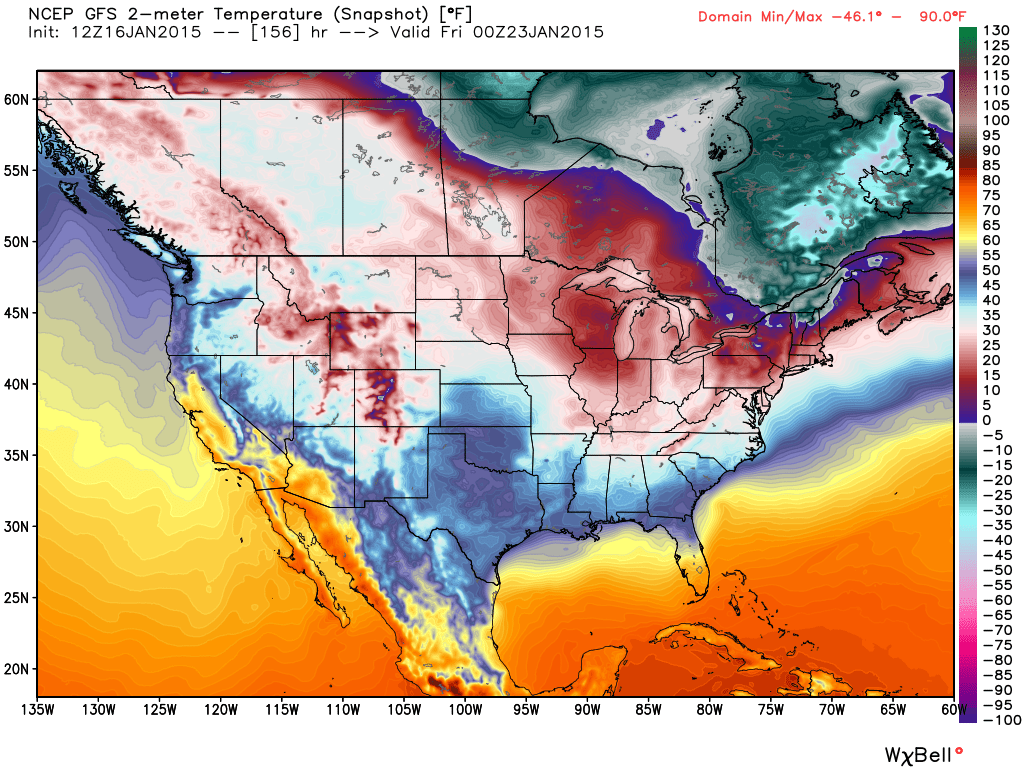
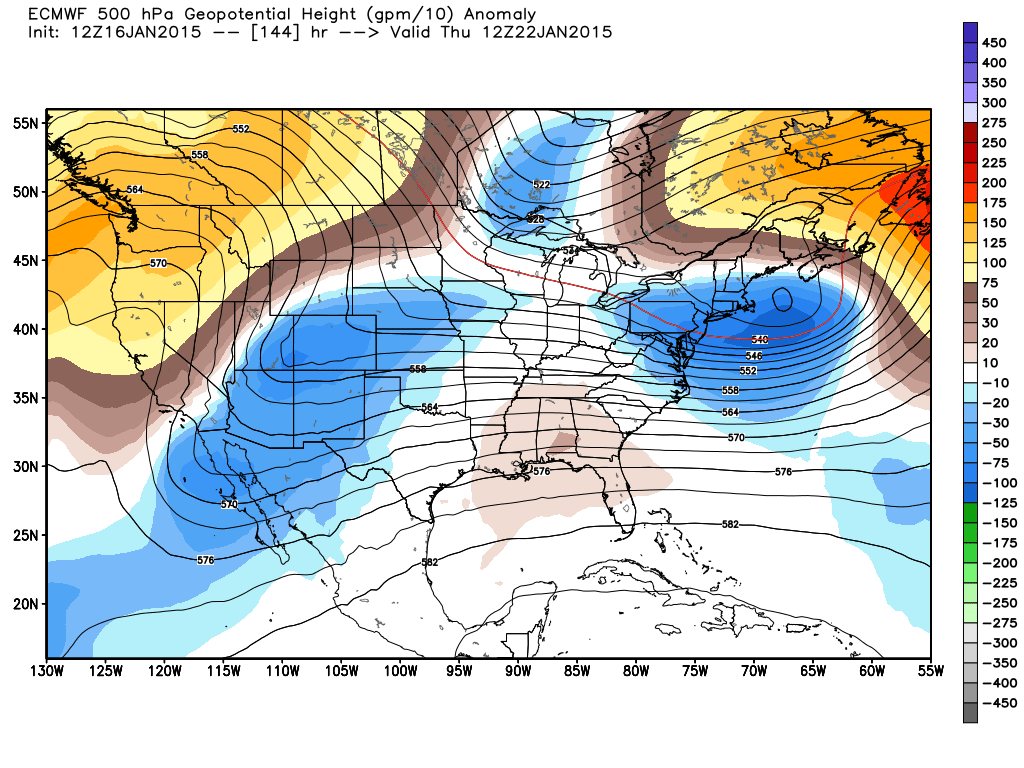
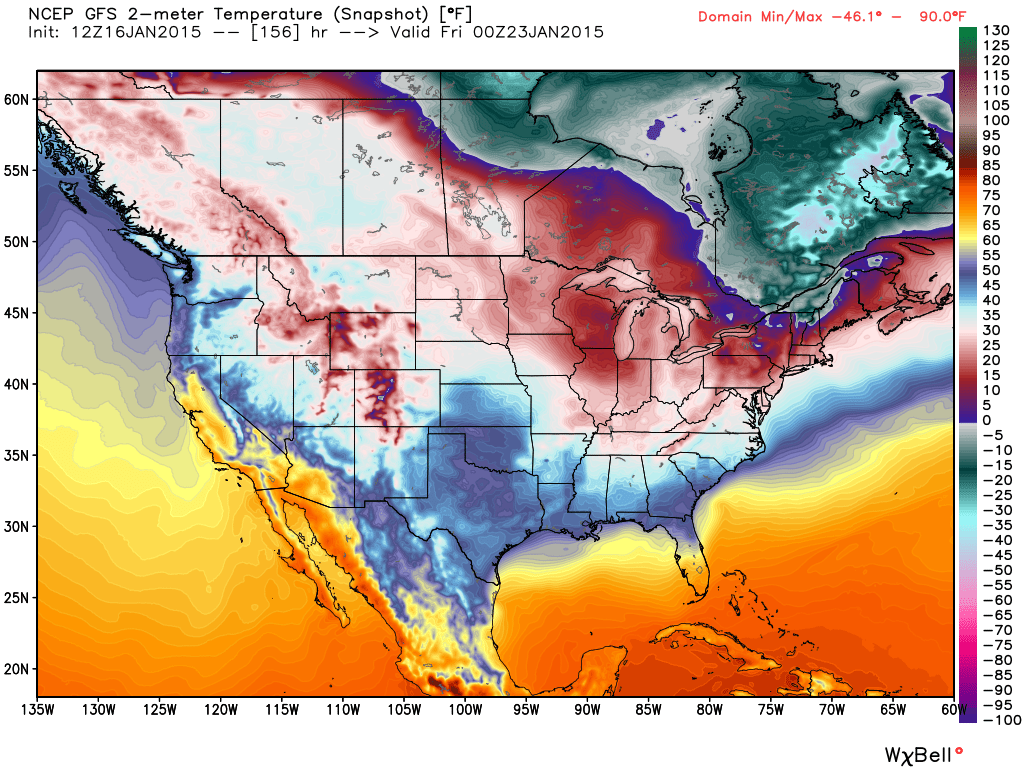
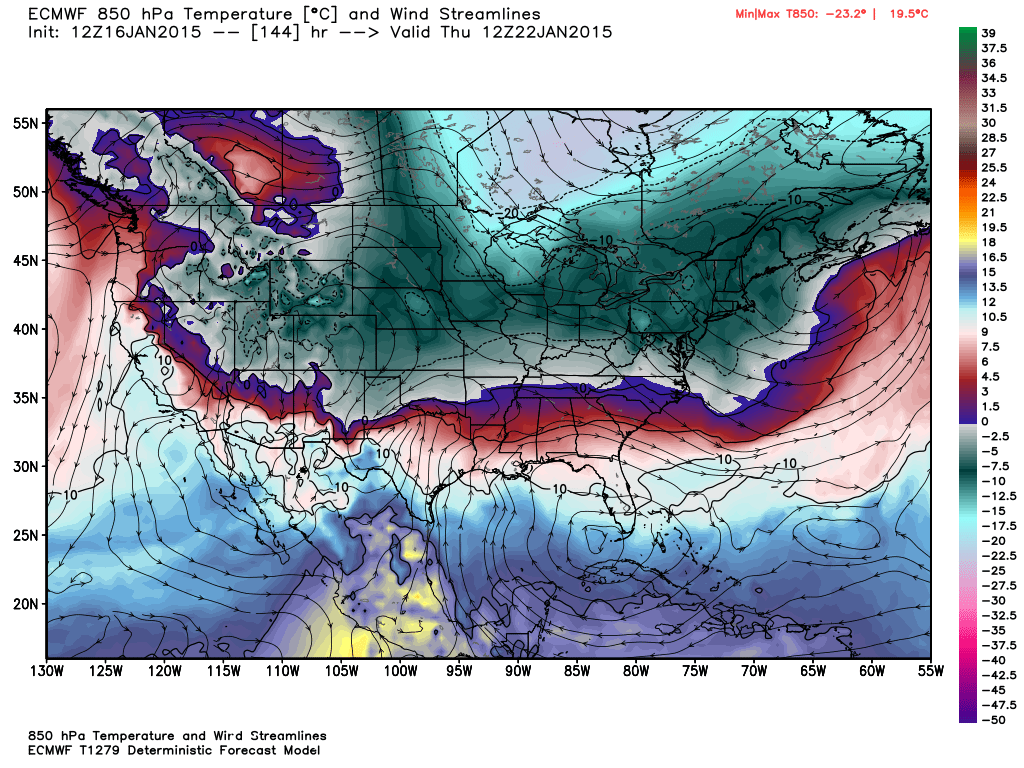
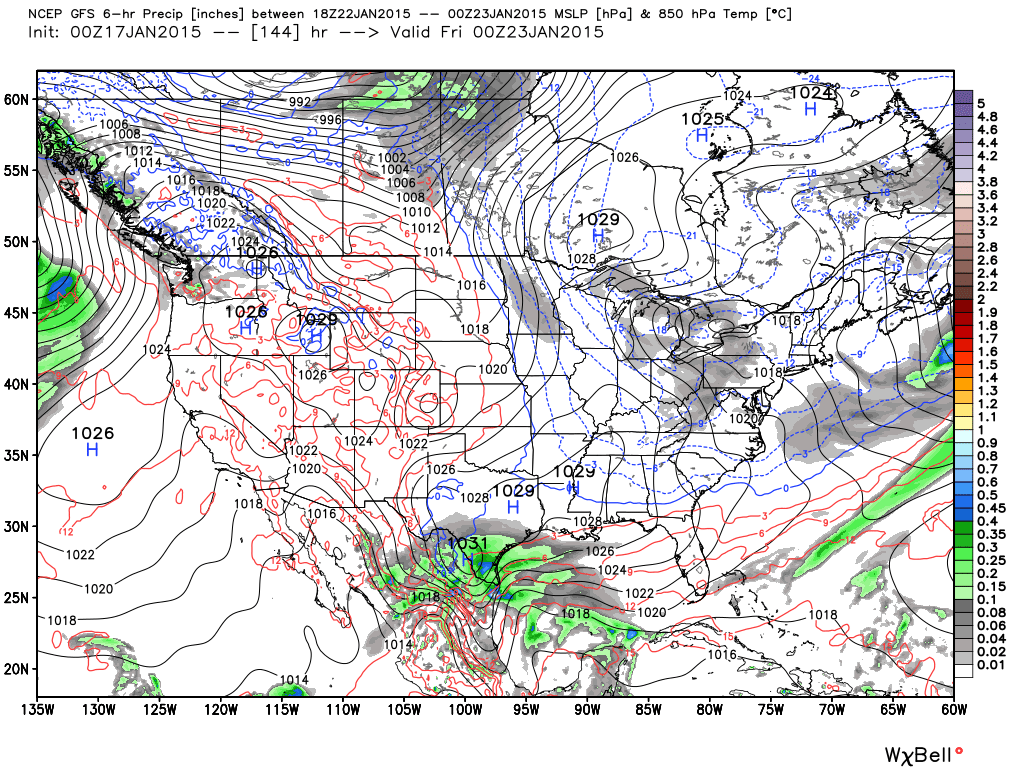
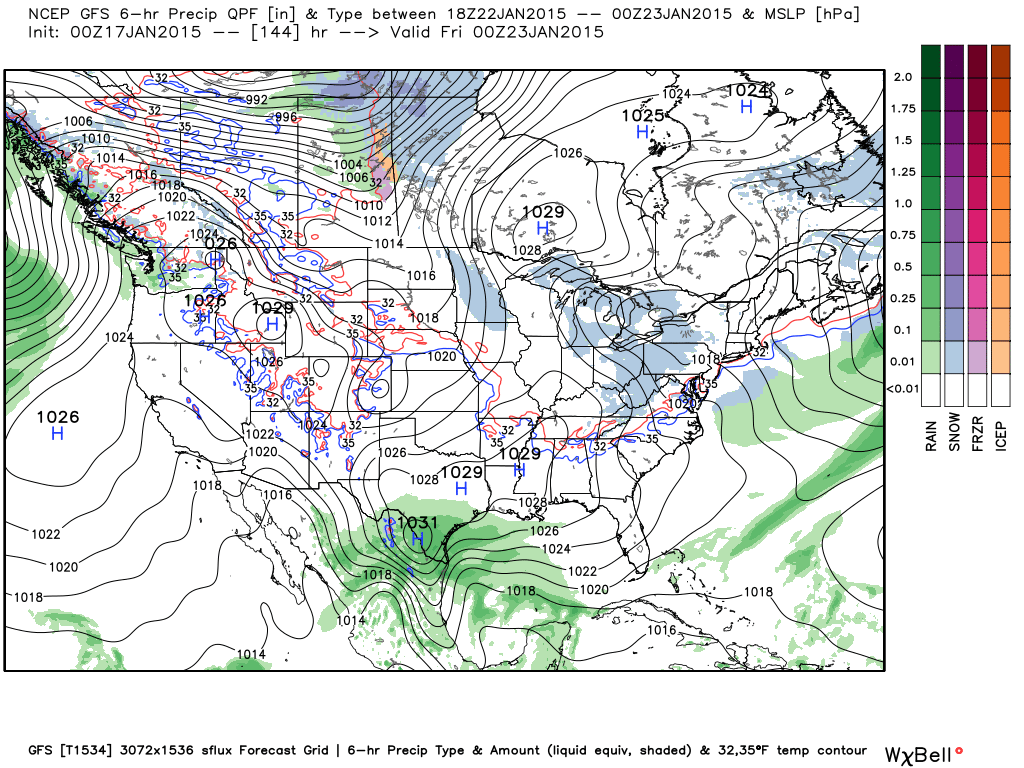
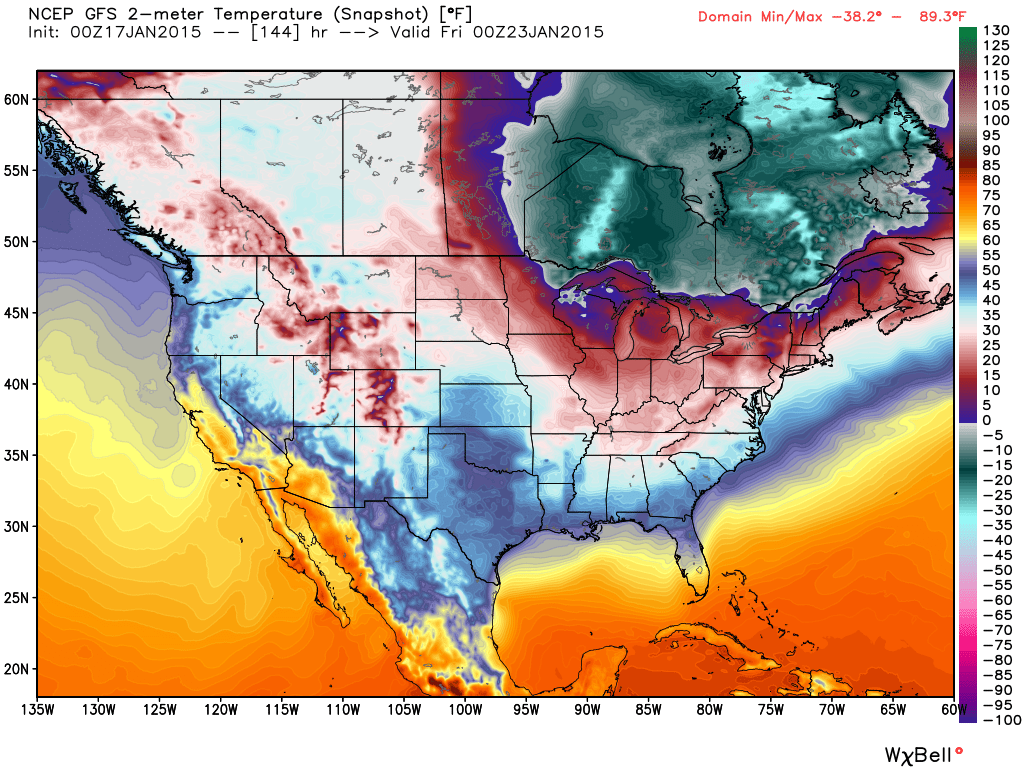
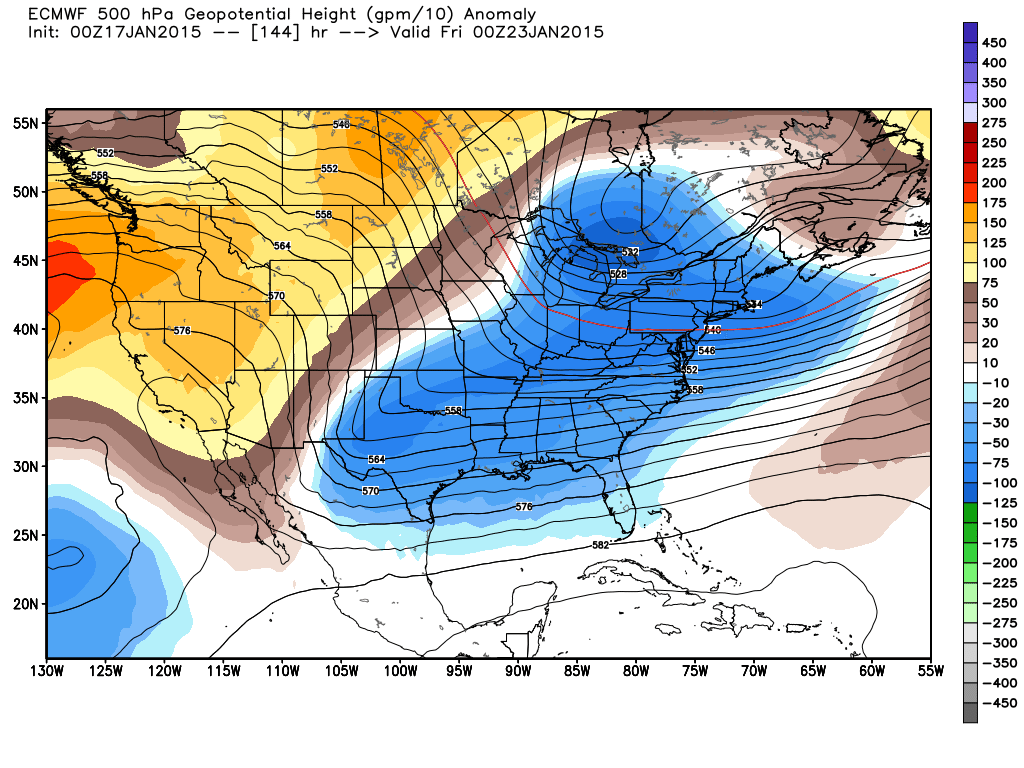
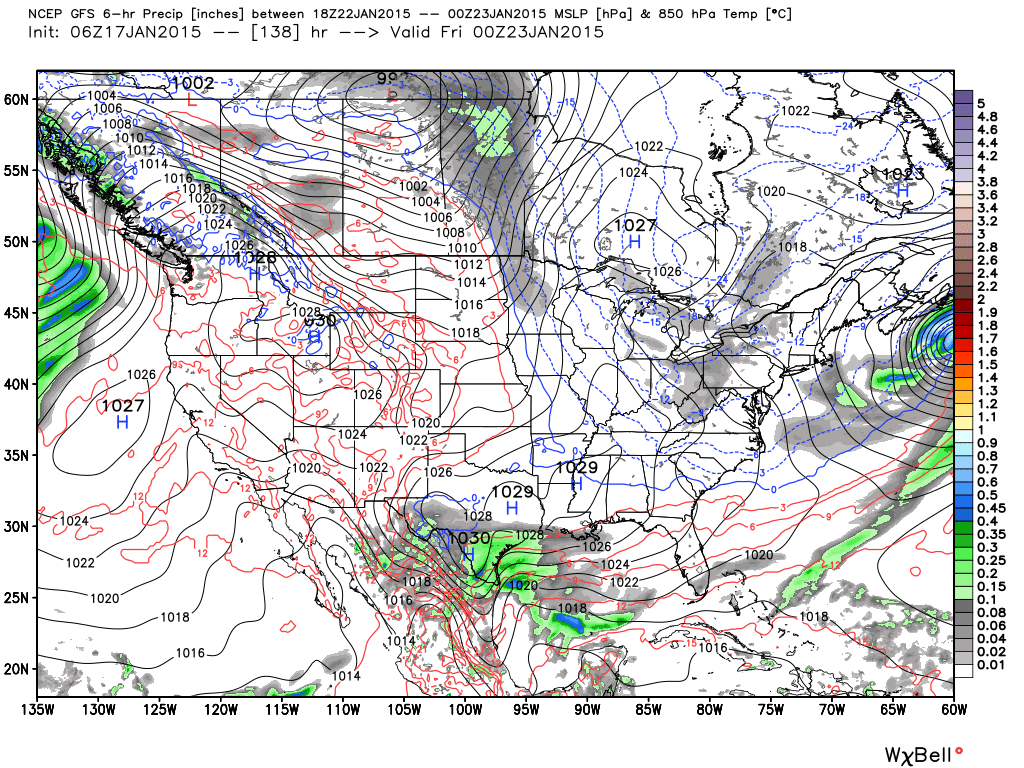
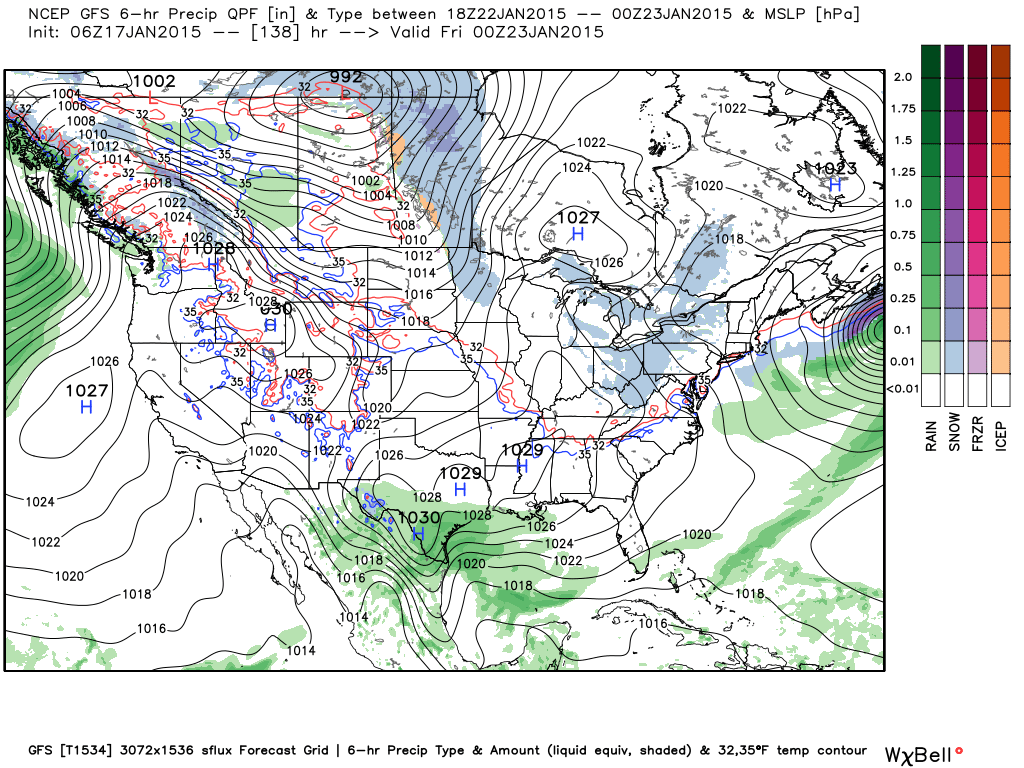
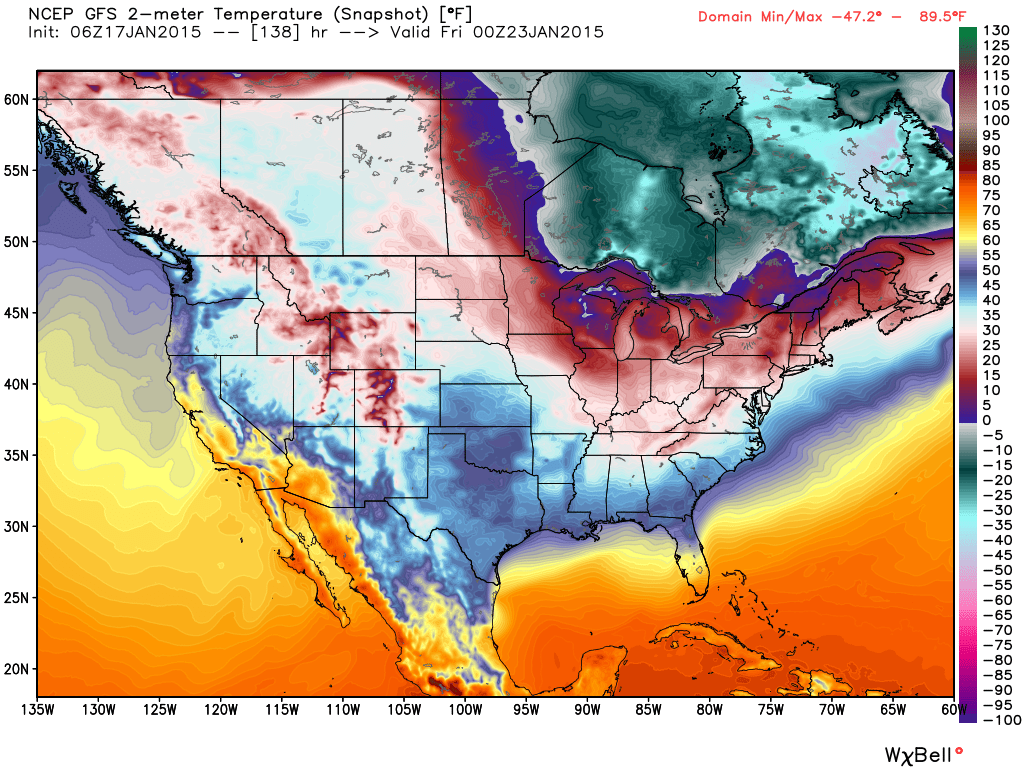
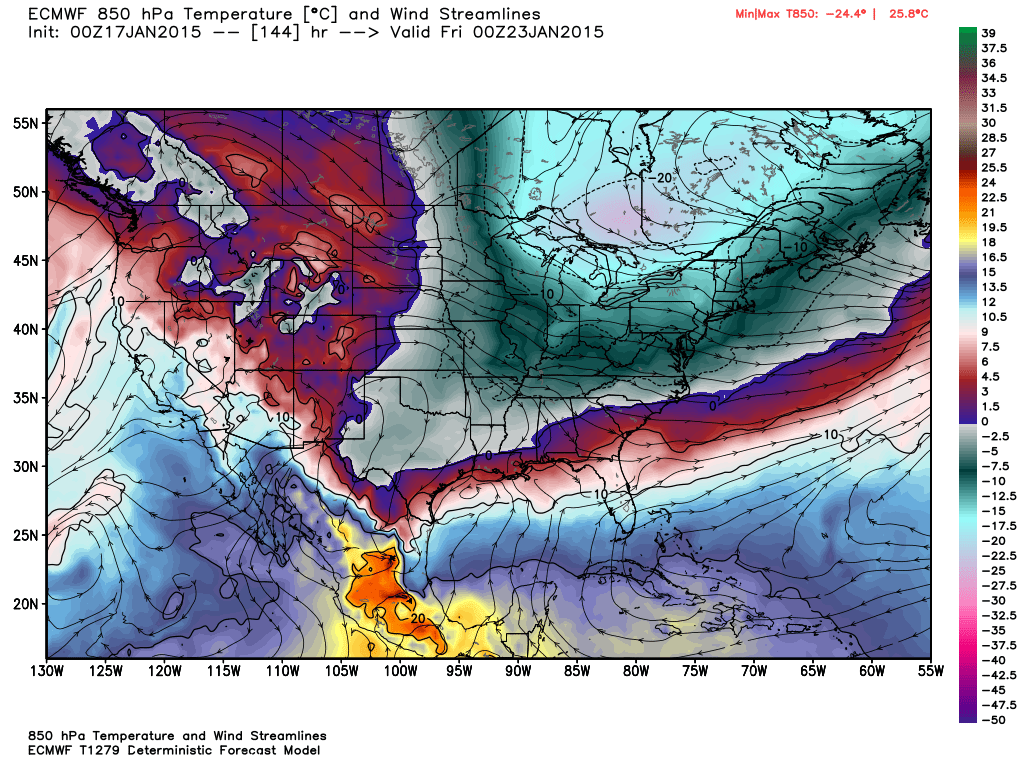
The last blog post didn't turn out too well, and the weather fooled many a meteorologist, so let's give this another shot. I thought is would be a good time to track the GFS and Euro for the upcoming potential winter weather event that's on the horizon for the 23rd of the month. There is an event coming up 3 or 4 days after this system that probably has a better chance of becoming something, but this was in closer range so I went with it. I wanted to visually see how the models ebb and flow with their outputs and see who can get the closest to what is actually going to happen, so I am displaying 4 maps (3 GFS, 1 Euro) for each of the 4 daily model runs. For the GFS, those runs are at: 00Z = 7 PM the night before 06Z = 1 AM 12Z = 7 AM 18Z = 1 PM Once we go to daylight savings time, there is a 4 hour difference instead of 5. Since I can't display all of the Euro maps, and since they only run twice daily (00Z and 12Z) versus the GFS at four times a day, I'll be displaying the 500 MB anomalies and 850 MB temps from the WMO for the Euro. All of the images can be enlarged by clicking on them. All the maps are from Weatherbell and Dr. Ryan Maue. Maps from Friday, January 16th for Friday, January 23rd00Z Run06Z Run12Z Run18Z RunMaps from Saturday, January 17th for Friday, January 23rd00Z Run06Z Run12Z Run |
Archives
March 2019
Categories
All
|
OLD NORTH GA WX BLOG


 RSS Feed
