 Current tropical convection in the MJO regions. Notice the enhanced convection around areas 3-4 (see region map below) Current tropical convection in the MJO regions. Notice the enhanced convection around areas 3-4 (see region map below) There have been grumblings about the "fly in the ointment"... the MJO. For those that don't know, the MJO stands for the "Madden-Julian Oscillation", an intraseasonal oscillation that is observed mainly over the Indian Ocean and Pacific Ocean, and has a major influence on our weather here. The MJO influences on the weather in Georgia, depend on the time of the season and the phase of the MJO. What might be a favorable phase in February, might be a terrible phase in June. So it's important to understand what the specific influences are for any given time period. First... lets take a look at the graph below of the MJO. This particular graph is from the GFS just because it's free and easy to pick on . :-) You see all 8 phases outlined on the graph as well as the general location of the MJO signal. It's important to note that the MJO is a traveling pattern, moving eastward at approximately 4 to 8 m/s through the atmosphere. So you can see this graph started on the 22nd of December (purple START) and each dot is a day. It's just like connect the dots... just follow the line around and through the different phases into January and then into February. You can see that the GFS takes the MJO into what is known as the COD or "Circle of Death", and I guess the COD deserves some little bit of explanation. As you go further to the outside of the graph, the amplitude or the strength of the MJO increases, as you go inside the COD, the MJO signal is barely discernible about the noise. This is important to note as you'll see later. You can find many of these images and much more, by clicking here for my MJO page.  So now that you see how the graph works, let's look at the different phases of the MJO and see exactly what that means and how they can influence our weather. MJO Phase This map shows the general phase location of the MJO signal. This map shows the general phase location of the MJO signal. When the MJO is in a particular phase, it means that anomalous precipitation and convection is taking place in that phase, that can also be strong or weak. The image on the left gives you a general idea where this area of enhanced convection is occurring. Now, take a look at the graphs below. These images are for Jan-Feb-Mar, and remember, the influence the phase has on our weather varies by month. The temperature anomalies are the two left columns, and the two right columns show the probability of the left side happening. So as you can see, for our neck of the woods in February, we would want to see the MJO in Phase 1, 2, 3, and 8, as those are the phases that are favorable for cold weather this month. 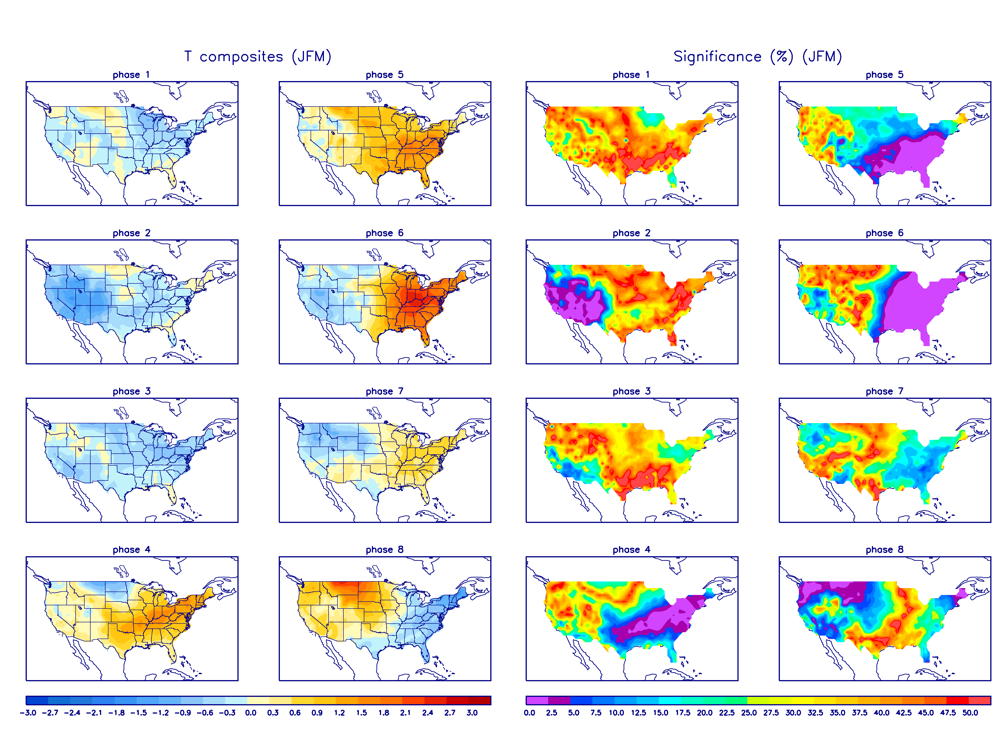 The MJO doesn't just affect temperatures either, here's a chart showing like the one above, but showing precipitation anomalies, and you can see that some phases are more favorable for precip than others.
So, what does all of this mean for us and why is the MJO the fly in the ointment? As you know, it's tough to get winter weather in Georgia outside of the mountains, we need to get everything lined up just right for snow. The fly in the ointment is that the MJO may end up in a phase that is fighting against the cold air trying to push south. Bastardi has had this as a nagging fear. You can see from the MJO forecast graphs below, all the models have a different idea about the progression of the MJO. There is one thing important for us though, even if the signal goes into the COD, that is not bad for us here in Georgia, as a matter of fact, some of our best winter weather events have occurred when the MJO was in the COD. bot there is one ominus note to that stat, all six of Atlanta's major freezing rain events have been when the MJO was in the COD. Be careful what you wish for.... So for us here, as long as we either stay in the correct phase or we see a very weak phase for those that are not favorable for us (or in the COD), the MJO should not be the major player that some have alluded to. However, if it decides to do as the Euro shows with a medium strong signal that rotates through 4,5,6,7, and 8 phases, then we may have some issues to deal with. We shall see. |
Archives
March 2019
Categories
All
|
OLD NORTH GA WX BLOG

 RSS Feed
|
Never base important decisions on this or any weather information obtained from the Internet. Always have a backup method of receiving weather information such as a battery powered weather radio.
Copyright © 2018 NorthGeorgiaWX.com and DaculaWeather.com 
|