|
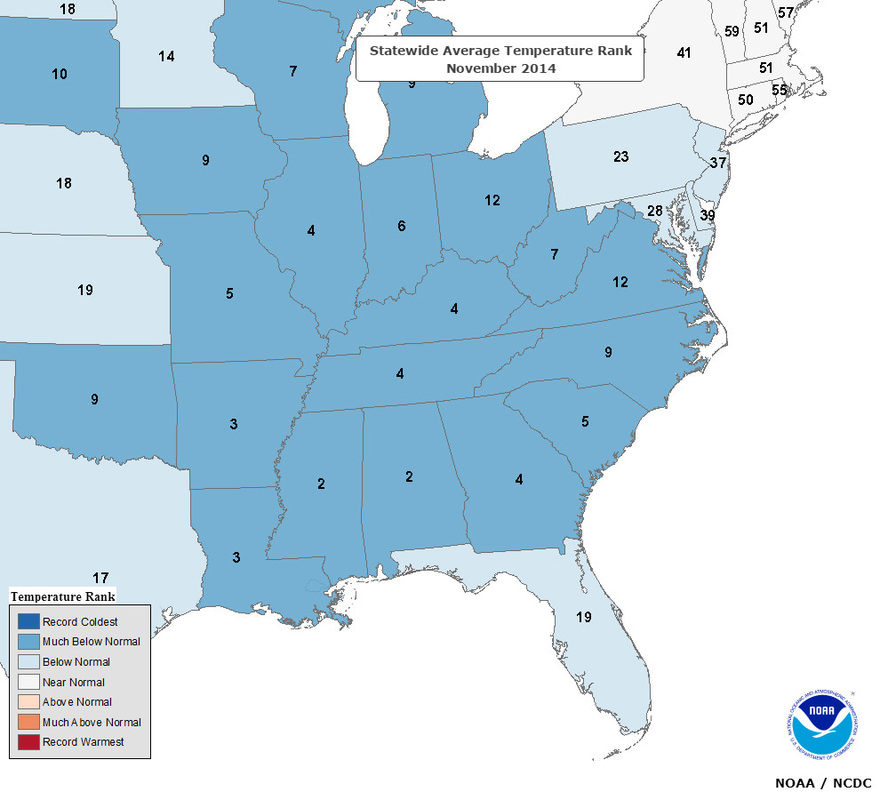
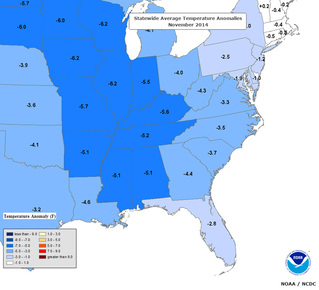
Lots of weather going on right now and big changes brewing over the next two weeks, so let's dive right in and take a look at what we see coming down the road. Meteorologist are watching this last week of December with great interest right now, as there appears to be several legitimate chances at winter weather across the southeast, and for a while now the models have been hinting at this upcoming pattern change that is getting ready to take place beginning next week. By now everyone knows that November was well below normal for us here in Georgia and much of the eastern US. Here are two maps, one shows that Georgia had the 4th coldest November ever, the other map shows how far below normal we actually were. I think everyone got spoiled with those early winter like temperatures and expected those to last through the rest of winter! No such luck though. However, the warm up we had during the first week of December was expected as well as the one coming up for next week.
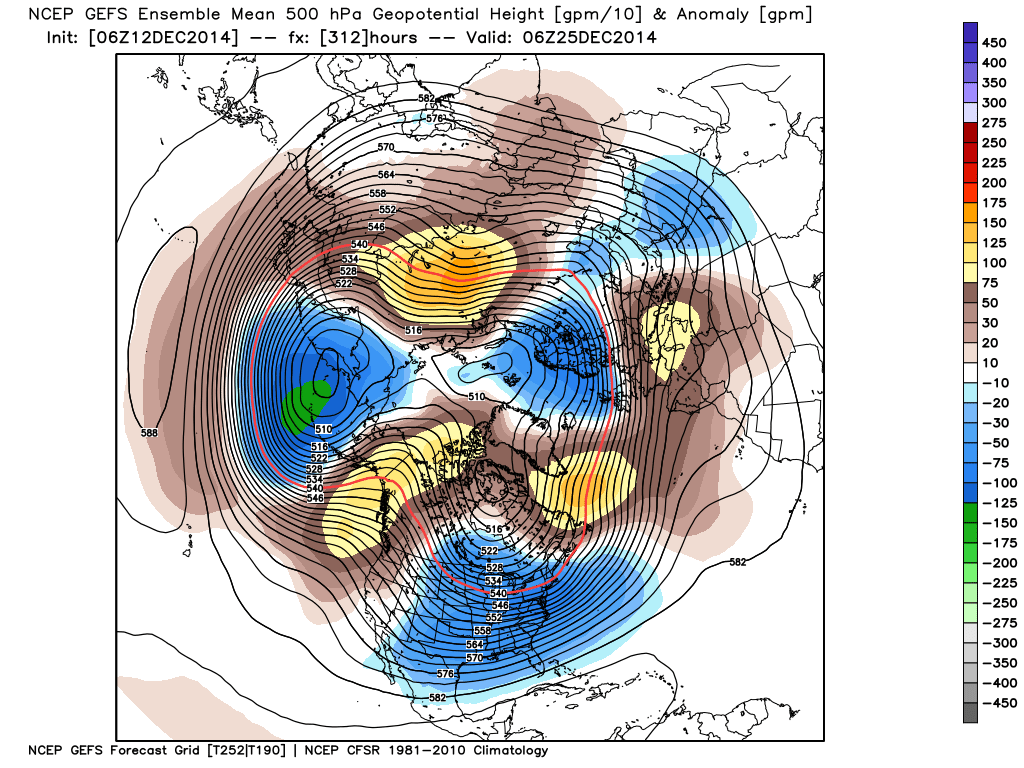
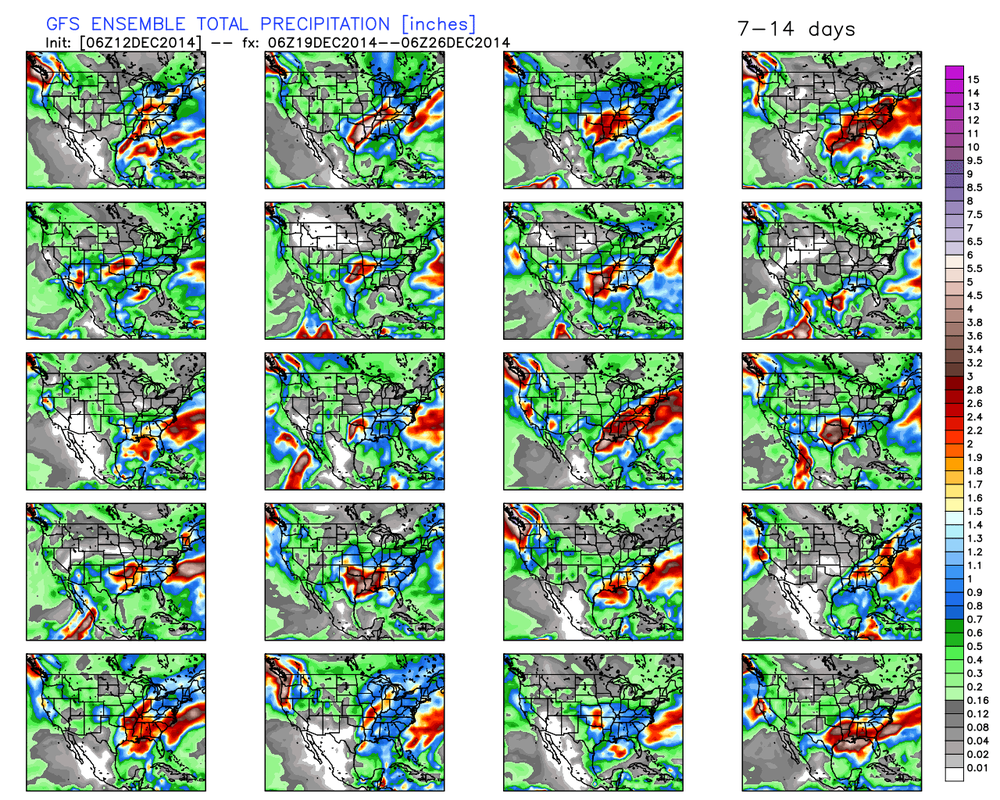
The west coast is currently being flooding with moist Pacific air as a big upper level low spins just off the coast. This rainy pattern is all part of the El Nino like pattern that is beginning to take shape. What will begin to happen over the next several weeks is that a large ridge will begin to form just off the west coast which will help to shunt the storms to the south and into the path of the southern jet stream. With this high in place, systems will begin to traverse the southern portion of the US and follow tracks that are very conducive to winter time storms along the Gulf coast (we hope). The track along the coast is ideal for us here in north Georgia. If you look at this map of the track of the storm that brought us a White Christmas in 2010, you'll see what I'm talking about. That type of low track is what we want to be on the lookout for. 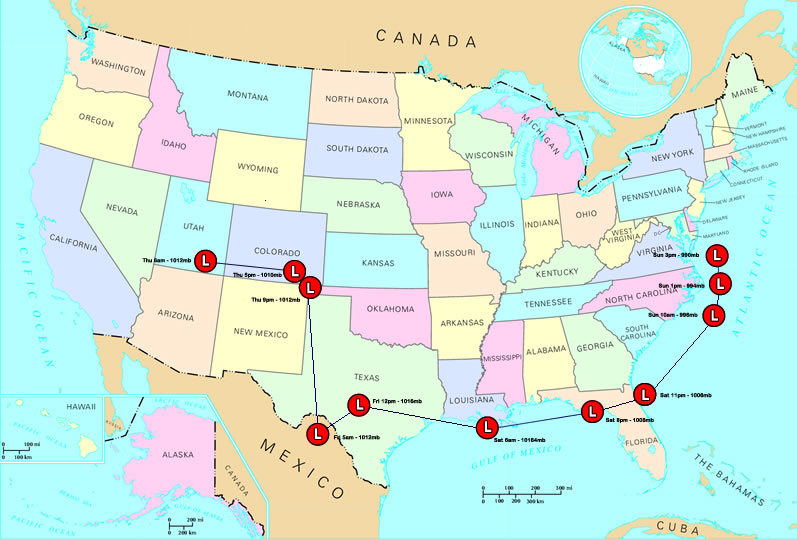 Track of 2010 Georgia White Christmas winter storm So now that we know what we want to look for, let's see what we can find right now. The two maps below are from the GFS ensembles. The map on the left shows 500 Mb height anomalies for December 25th. This is the upper air pattern that the GFS is depicting right now, and it shows a large trough over the eastern US with blocking near the west coast and Greenland. Blocking like this forces the cold air move south as it's not able to move very far east. The map to the right is the ensemble precipitation forecast. Each map within that map is a run from an individual ensemble member. You can see that many of the members are beginning to show some major precipitation falling over the southeast over that time period. At this point the Euro isn't quite on board as much as the GFS but it still has a similar look to it.
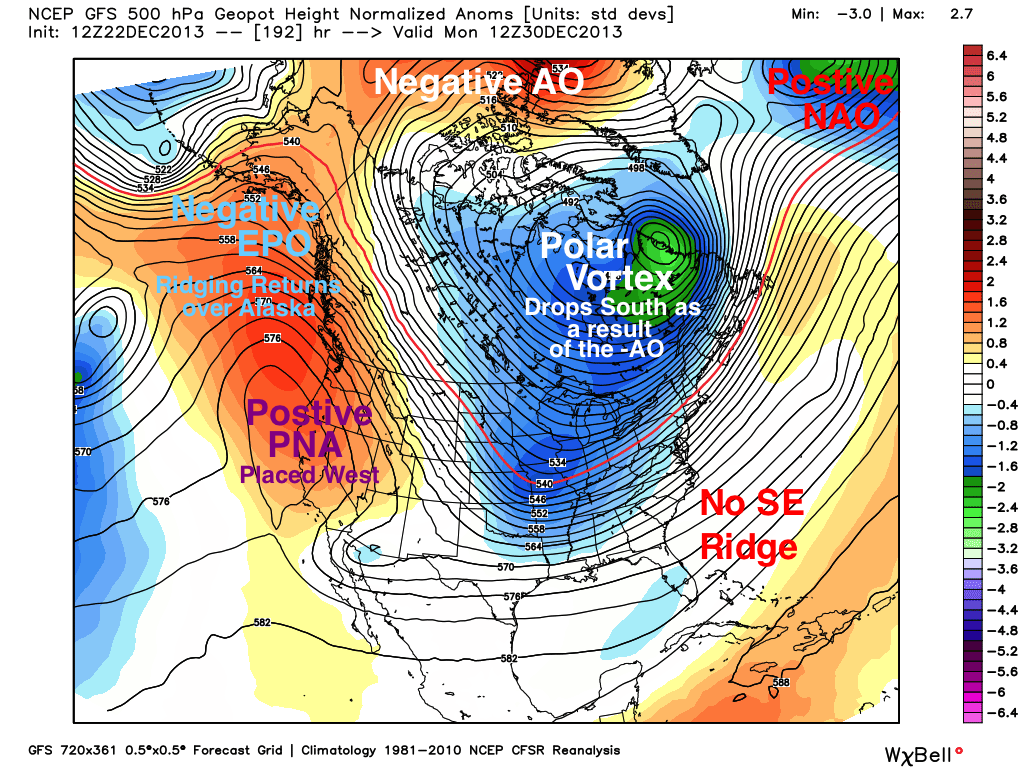 Examples of -AO, +PNA, -EPO Examples of -AO, +PNA, -EPO We're watching the teleconnection patterns with great interest right now. What we want to see is a -AO and -NAO in order to get the blocking that we need to bring the cold air south, and the GFS ensembles are showing that both should be heading toward negative values by the end of the month. We're also looking for a +PNA and -EPO signal and both of those seem to be in our future. The GFS ensembles show the EPO dropping off the charts almost. The positive PNA sets up the ridge off the west coast, the -EPO retrogrades the stubborn low pressure over the Gulf of Alaska westward, and the -AO provides over the top blocking. The map shows a +NAO but the -NAO will build as the winter progresses and will help to lock in the cold over the US. Here's a great map that depicts that setup. Now all the need to get is cross-polar flow from Siberia and brrrrrrr. 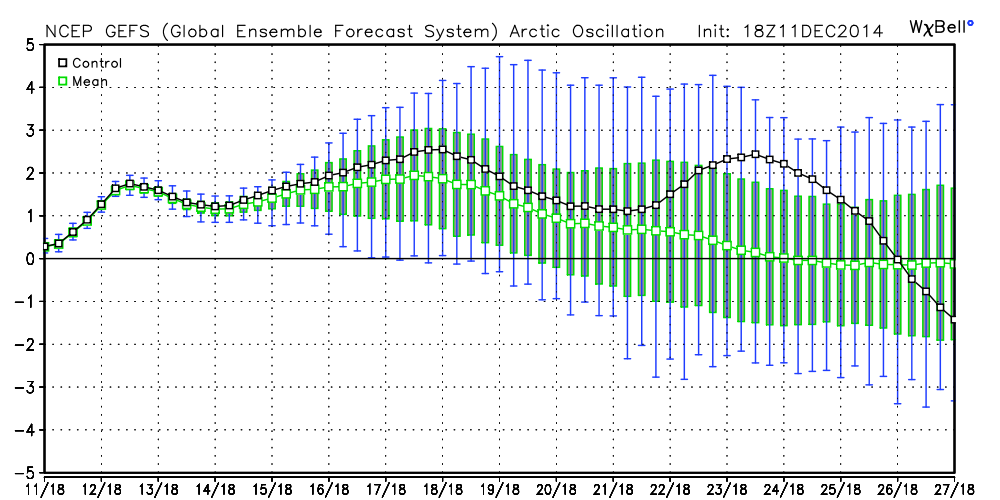 GEFS Arctic Oscillation (AO) - Maps from Dr. Ryan Maue @Weatherbell.com 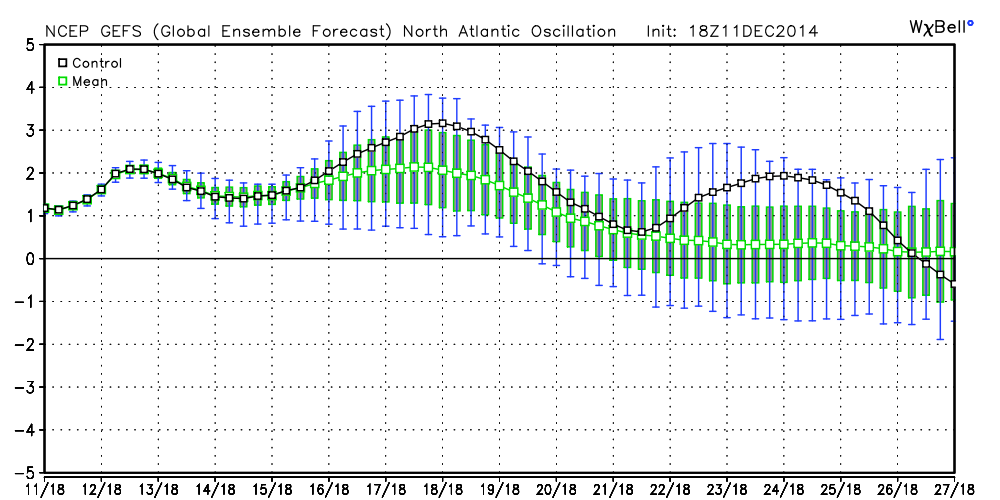 GEFS North American Oscillation (NAO) - Maps from Dr. Ryan Maue @Weatherbell.com 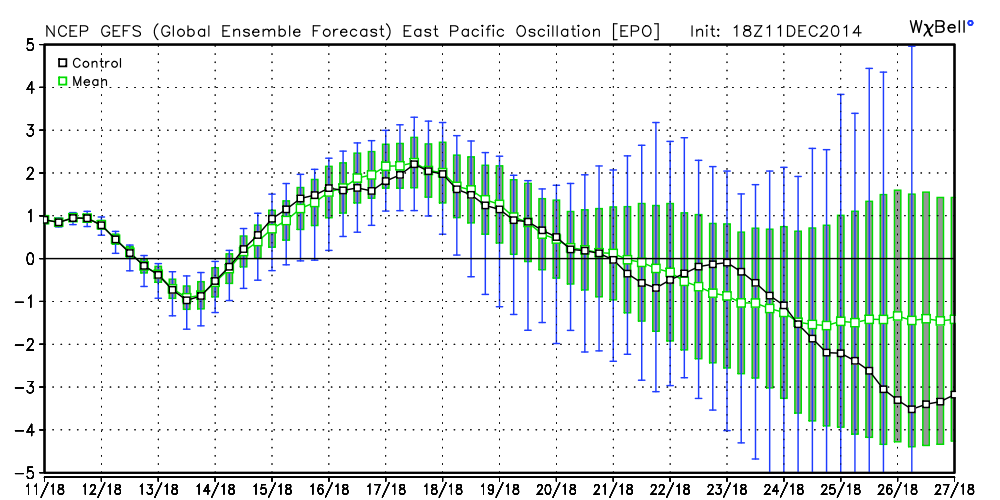 East Pacific Oscillation (EPO) - Maps from Dr. Ryan Maue @Weatherbell.com 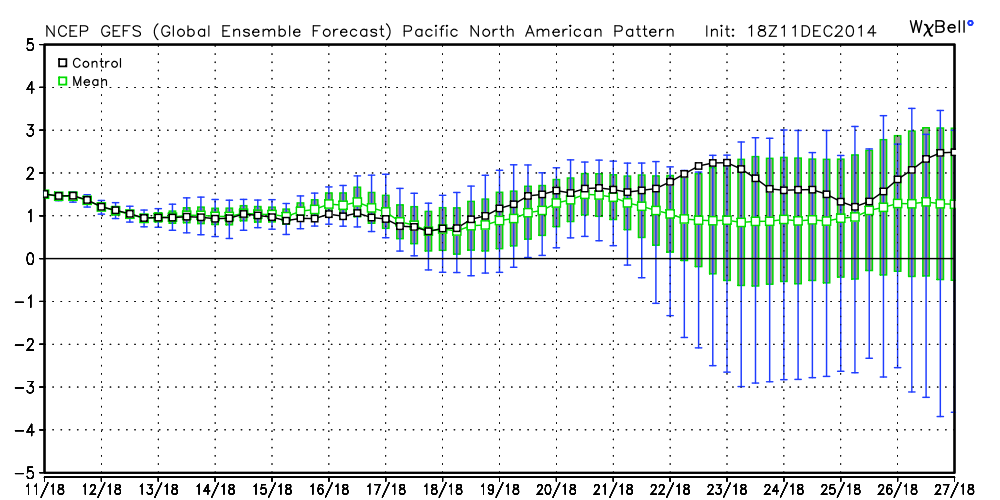 Pacific-North American (PNA) pattern - Maps from Dr. Ryan Maue @Weatherbell.com Post from various meteorologist... I want to share this post from WXRisk that also helps to explain what is about to occur over these last several weeks. I have been talking about the December 22-26 change for over a week now so the TREND IS MY FRIEND. One of the reasons why I am not particularly bullish about the event/threat for December 21 is that the overall pattern on a hemispheric scale ...is not very favorable. Yes the models DO show what appears to be cold HIGH in a pretty good set up ...at least for the beginning of the event. The problem is that the flow at 500 MB across Canada is Pacific and ZONAL and has no arctic connection. Thus the HIGH is NOT very cold and has to be the perfect ideal position when the coastal low begins in order to keep some of the precipitation snow.The only reason why this is potential threat to begin with is the development of the big ocean low over southeastern Canada (the 50/50 LOW). The NAO is strongly positive which along with the Pacific pattern strongly interdicts the supply of cold air into the Northeast US. But beyond the December 21 event... if we use the overall hemispheric pattern as a starting point we can truly see some significant changes taking place across the hemisphere by December 25th. Here is the 324 hour EURO Ensemble Mean.... It shows several important things... many of which are self explanatory. 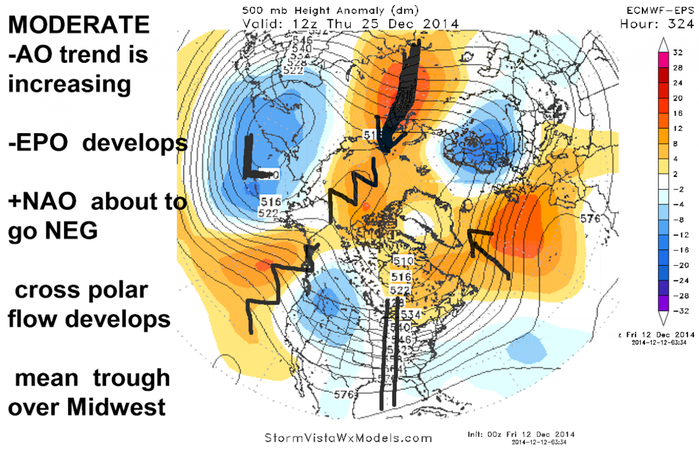 The 5 day CFS from from the website Tropicaltidbits.com web site has been showing this for while.... and increasingly amplified +PNA and -EPO pattern . Now the euro ensembles are showing this as well. See image. The one thing that should be noted is that we do not on this map yet see a -NAO and the Polar Vortex is still very far to the north over Baffin island. Here is the week 3 and 4 500 MB anomaly maps from the CPC. I have drawn in some key features for ease of comprehension. The CFS clearly indicates that the pattern amplification is going to really picked up speed in week 3 and week 4 . The -EPO goes absolutely ballistic in week 4 and strongly resembles what we saw last January 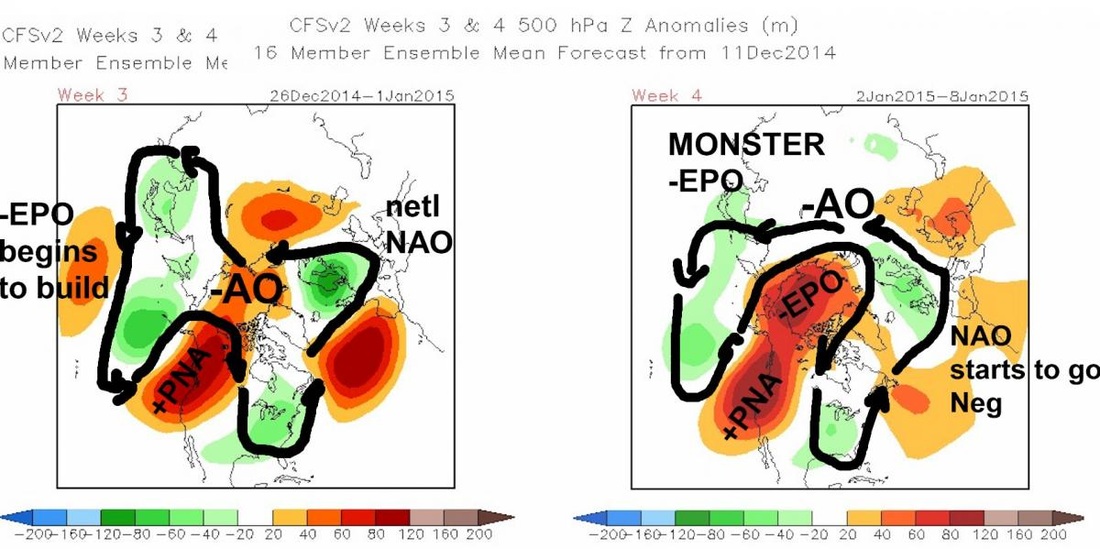 But again ...even though there IS a -AO we do not have -NAO yet and here is why. Next week as the zonal flow across Canada begins to amplify and it will take on the WIDE and BROAD shape. We can all see that. Because of this, the Polar Vortex is forced to over to Baffin Island in far Northeast Canada. This in turn means any RIDGE is forced over Iceland or the UK or Norway ...and the NAO is either positive or neutral. BUT as the western Canada ridge amplifies ... it will get pulled WEST because of the --EPO development. This will cause western Canada ridge to sharpen up.... which in turn will allow the PV to shift SW into Hudson Bay, and THAT that in turn will allow the NAO to go Negative in January. WXRisk.com
This comes from Mr. Donald Sutherland this afternoon.
This from Bob Chill (ok, not his real name... he use to work for The Weather Channel) Excellent GEFS run today. Very supportive of the cold outbreak. Growing support for a -nao down the line. Check out some of these members. 
And lastly, a post from Eric Webb. Eric is a weather wiz if there ever was one and it's been great to latch on to his vast knowledge. He is very detailed in his work, and loves to explain weather to all of us weather geeks. :-) 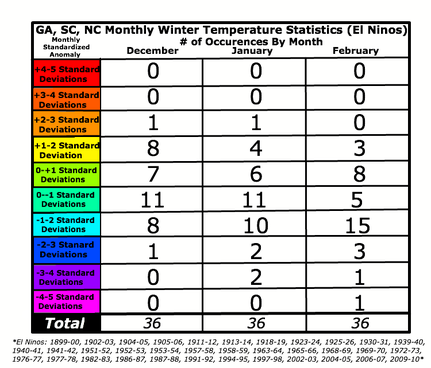 Image from Eric Webb @webberweather Image from Eric Webb @webberweather As I've shown w/ this graphic many times before it doesn't matter what the intensity or placement of the ongoing El Nino or warm ENSO Neutral Event is, January & February are more than likely going to end up colder than normal, more so than December, which is typically the most boring month in an El Nino winter anyway... Statistically, January & February are not only colder than December, but have more higher quality cold Januarys & Februarys, w February clearly the coldest of the 3... We've seen 36 El Nino events as defined by the ONI since 1900 (used 1971-2000 ONI climo for pre 1950 ONI record as noted by Bob Tisdale) (1899-1900, 1902-1903, 1904-1905, 1905-1906, 1911-1912, 1913-1914, 1918-1919, 1923-1924, 1925-1926, 1930-1931, 1939-1940, 1940-1941, 1941-42, 1951-1952, 1952-1953, 1953-1954, 1957-1958, 1958-1959, 1963-1964, 1965-1966, 1968-1969, 1969-1970, 1972-1973, 1976-1977, 1977-1978, 1982-1983, 1986-1987, 1987-1988, 1991-1992, 1994-1995, 1997-1998, 2002-2003, 2004-2005, 2006-2007, & 2009-2010) Here are the statistics for Georgia, South Carolina, & North Carolina in the 108 winter months we've observed in all the El Ninos since 1900. I used the 1895-2000 base period for the pre-1950 El Ninos then used the 1981-2010 base period for the other events. I defined the months that were 1, 2, 3, & 4 standard deviations from normal as those if at least one or more climate regions in GA, SC, or NC had at anomalies that exceeded +/- 1 standard deviation, +/- 2 standard deviations, etc. February doesn't just look good compared to Dec & Jan visually, but also on paper. In fact, of all the El Nino Februarys that have been colder than normal, 16 of the last 17 (2003 as the only exception) have been at least one standard deviation or more below normal somewhere in NC, SC, & GA... (see chart above) Warmest El Ninos by month: December (1923), January (1952), February (1954) (See below) Coldest El Ninos by Month: December (1963), January (1977, in a virtual tie w/ 1940, however the changing base periods give 1977 the edge), February (1978) (See below) I'll also mention that it's pretty rare to see December colder than normal in the southeastern US & then have both January & February end up warmer than normal & in all El Nino events since 1900, it's only happened 4 times (1952-53, 1953-54, 1997-98, & 2004-05) or about 10% of the time... I thought this would be applicable to the current discussion, I'm not saying we're going to see the exact same results, but I noticed several weeks ago after the anomalous upper level low brought what was virtually unprecedented snows to the SC midlands, the uncanny similarity to 1966, which if you extrapolated into the following phase of the Lezak Recurring Cycle, led to snow on the US east coast in time for Christmas... We're still a long ways out & a lot of uncertainty remains but combined w/ -VP associated w/ the active cell of CCKW once again entering the favorable 30-60E longitude & the model guidance of course which is finally starting to show some consistency, this is interesting nonetheless. 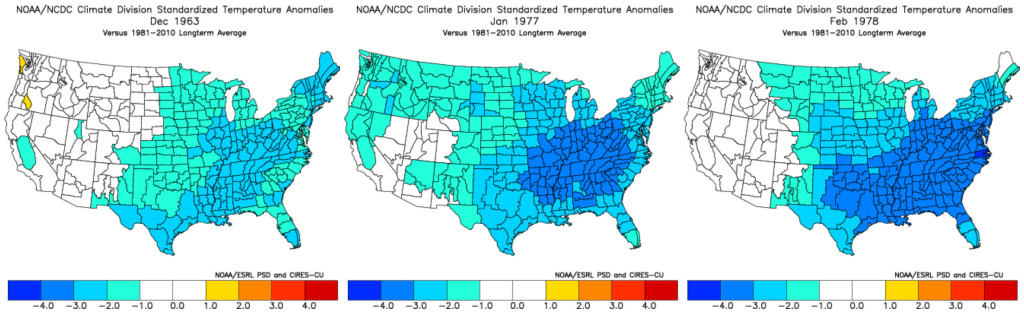 Coldest El Nino Winters for Georgia - Image by Eric Webb 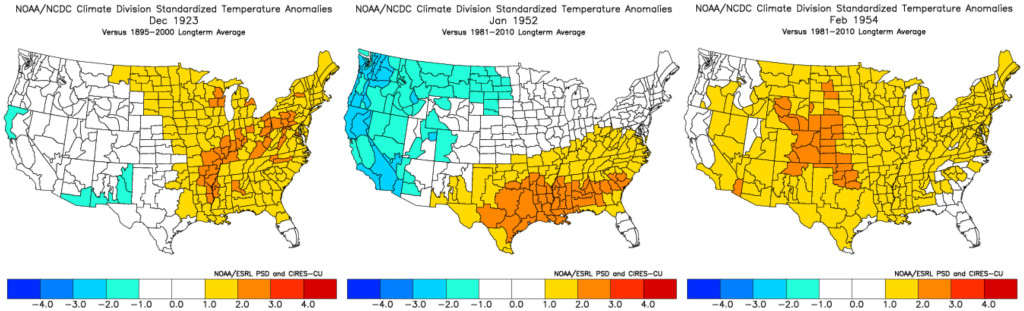 Warmest El Nino Winters in Georgia - Image from Eric Webb @webberweather Summary So as you can see, meteorologist are getting fired up about the upcoming pattern change and the weather to follow. I believe by the middle to the end of next week, we'll have a much better idea how this change is going to play out.
Stay tuned! :-) |
Archives
March 2019
Categories
All
|
OLD NORTH GA WX BLOG
 RSS Feed
|
Never base important decisions on this or any weather information obtained from the Internet. Always have a backup method of receiving weather information such as a battery powered weather radio.
Copyright © 2018 NorthGeorgiaWX.com and DaculaWeather.com 
|