 Early morning, October 1 image of Matthew. Early morning, October 1 image of Matthew. Good Saturday morning and the first day of October! The only real weather story and big question, is where will hurricane Matthew go. Let's first take a look at how Matthew did overnight and and then look at what the models are saying could happen. Matthew went from a tropical storm to a CAT 5 hurricane in just 33 hours, a feat that no computer guidance and no forecast called for. It just goes to show how unpredictable tropical systems can be, and despite how far we've come in predicting hurricanes and their track and intensity, there are times that Mother Nature says "I've got this..." and proceeds to defy humans and all of their skills. You can't help but be humbled and awed by the sheer power and unpredictability of a beast like this. It's one of those moments that makes weather so awesome... Credit for many of these images goes to WeatherBELL. OvernightHere's the 5 AM NHC discussion as to the state of Matthew: Matthew has changed little in organization since the past advisory, with a small eye surrounded by a central dense overcast featuring cloud tops colder than -80ºC (-122ºF). The eye has become a little less distinct, suggesting at least that the hurricane is no longer intensifying. In addition, the raw intensity estimates from the CIMSS ADT technique are slightly lower than they were six hours ago. Based on these trends, the initial intensity is reduced to 135 kt (155 mph). An Air Force Reserve Hurricane Hunter aircraft is scheduled to reach Matthew around 1200 UTC (8AM).
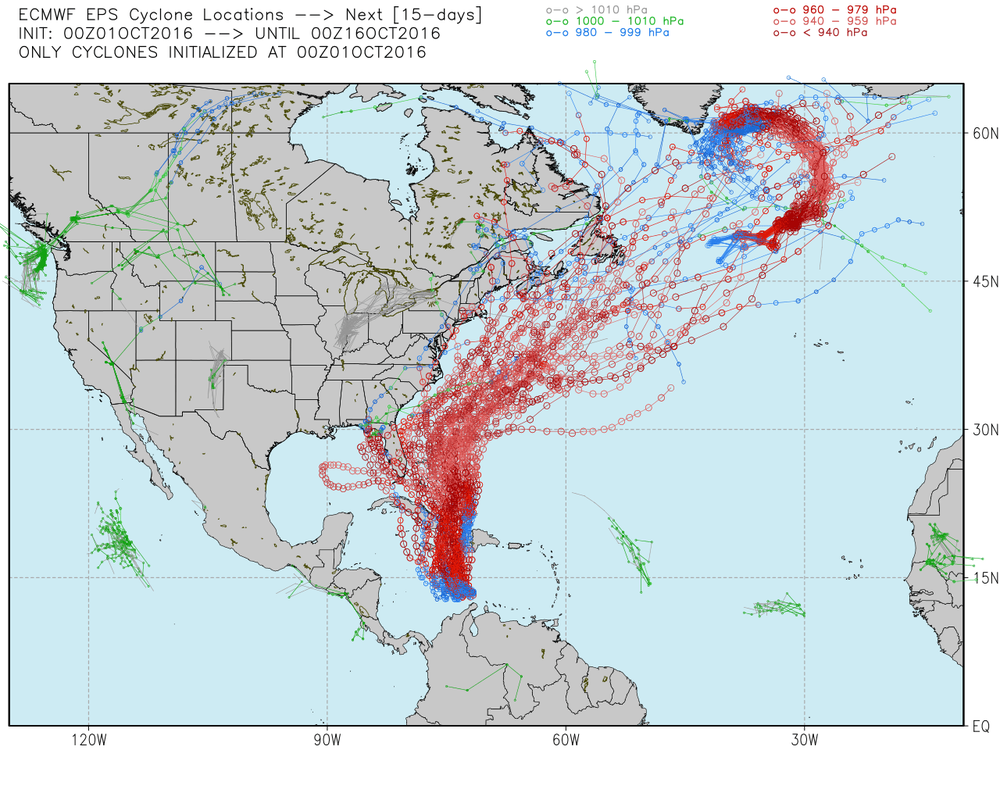
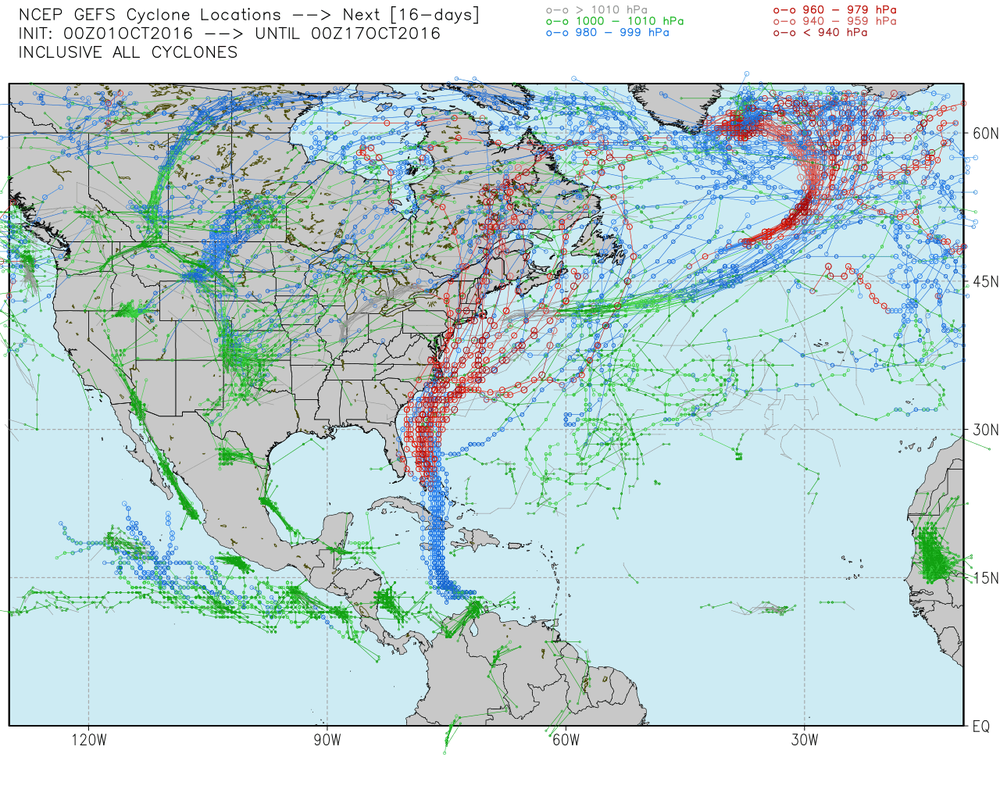
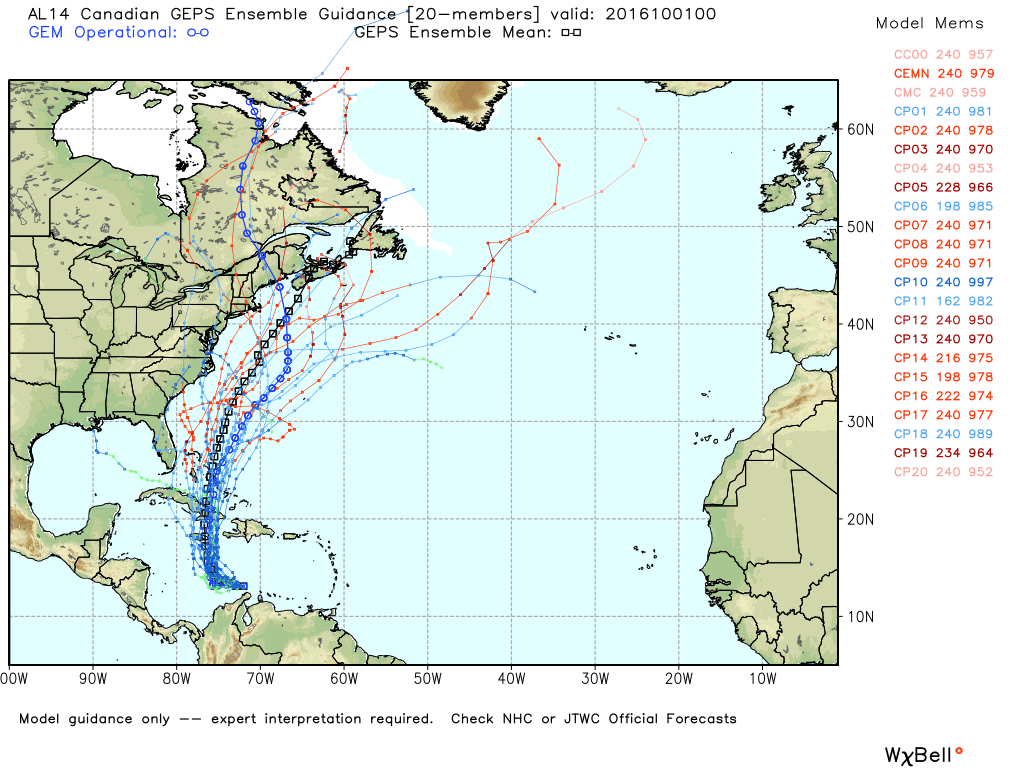
So Where To Now?So... let's look at the official forecast and go from there.  The NHC is thinking that Matthew will brush the coast of Jamaica and cross the eastern end of Cuba before striking the Bahamas early next week. The thought also is that Matthew will lose some steam as it crosses Cuba. "Matthew should experience significant shear for the next 24 hours or so, as water vapor imagery shows westerly flow blowing into the hurricane underneath the impressive outflow pattern. This should cause some weakening. After that time, the dynamical models suggest the shear should decrease, which should allow Matthew to at least maintain its intensity. The new intensity forecast shows a slightly weaker intensity than the previous advisory through 72 hours based mainly on current trends. Subsequently, the hurricane is likely to interact with the land masses of Jamaica, Cuba, and Hispaniola, leading to some weakening and disruption of the structure. Between this and uncertainty about how much shear Matthew will encounter north of Cuba, the new forecast shows only modest strengthening after Matthew reaches the Atlantic north of Cuba. There is also the possibility of fluctuations in intensity caused by eyewall replacement cycles at any time during the forecast period. So that is the official thought, now let's look at the computer models and compare the differences. Computer Models Are Just Guidance...There are some significant differences between the two major computer models, the American GFS and the European (or Euro or ECMWF). The GFS began a trend yesterday by shifting its tracks west toward the coast, while the Euro has gone much further east with its tracks. Here's a look at the Euro ensemble tracks (left) and the GEFS tracks to the right. Keep in mind that the Euro has 51 total members compared to the 21 members the GEFS has, and that is why the Euro looks more densely packed. It is however, the GFS members that are more tightly clustered from start to finish. The Euro operational (and the majority of its members) takes Matthew right between Cuba and Hispaniola before crossing the southern Bahamas and out to sea. Minimal direct hits to land and then no worries. The GFS scenario is a much more dangerous option.
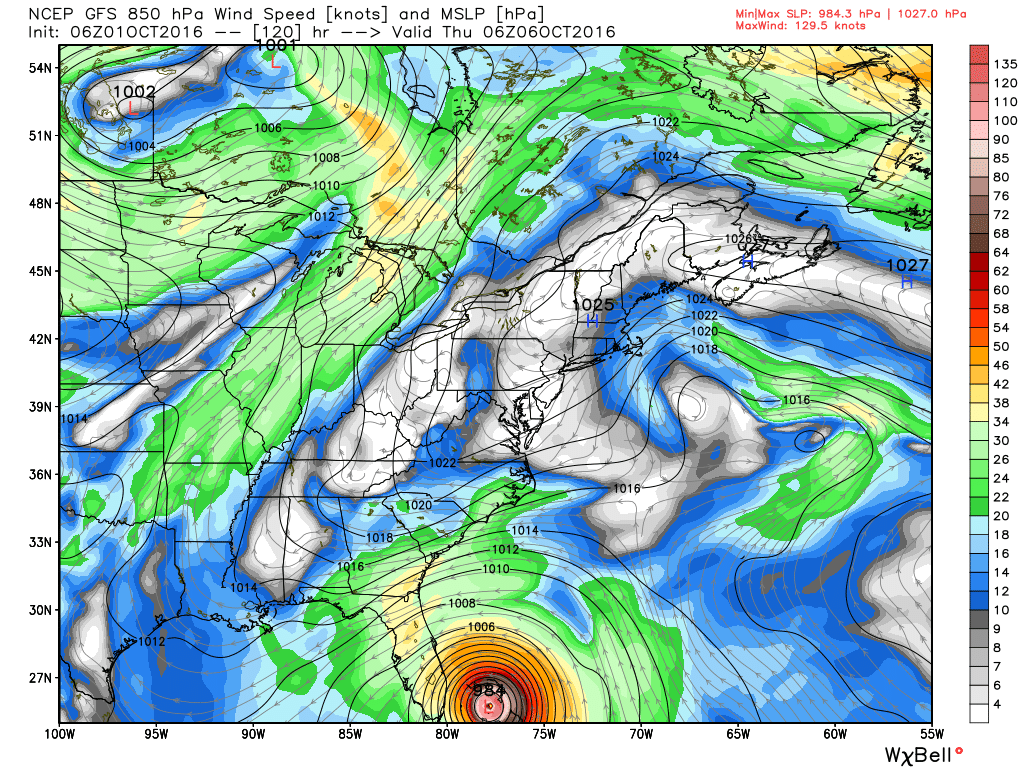
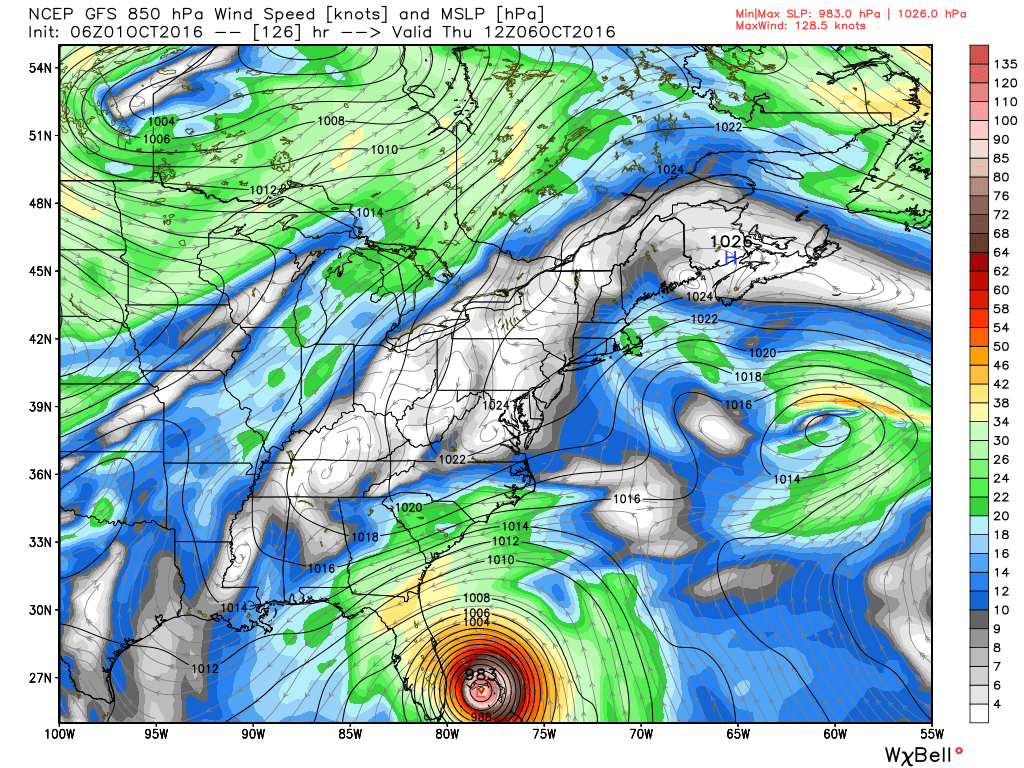
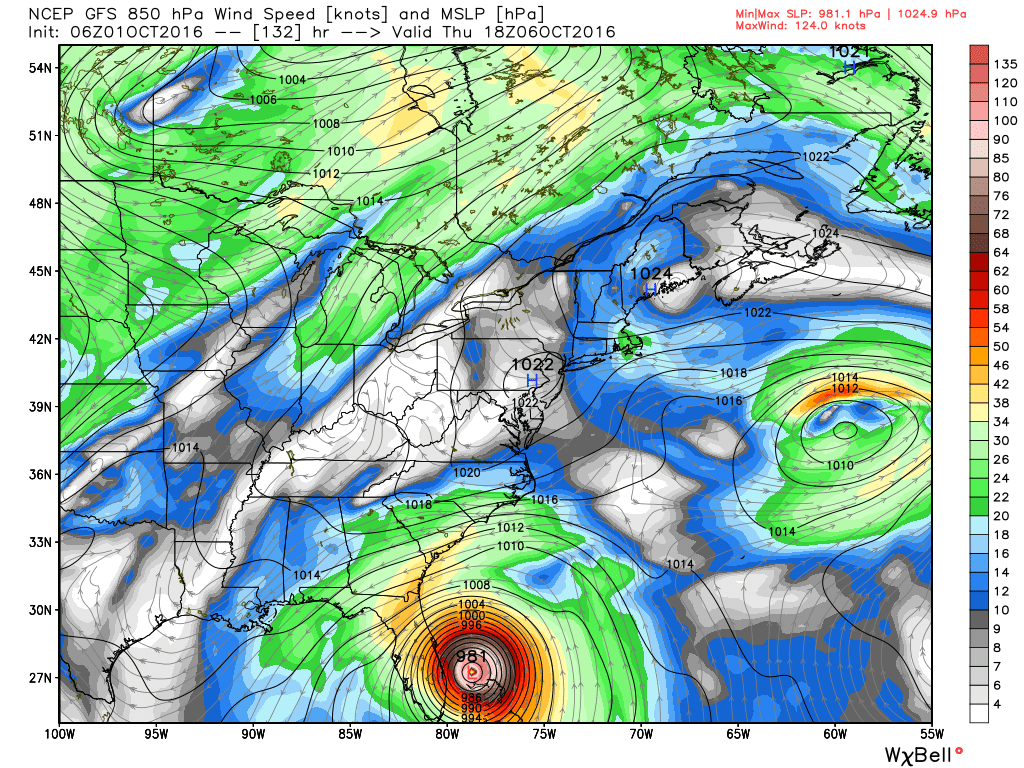
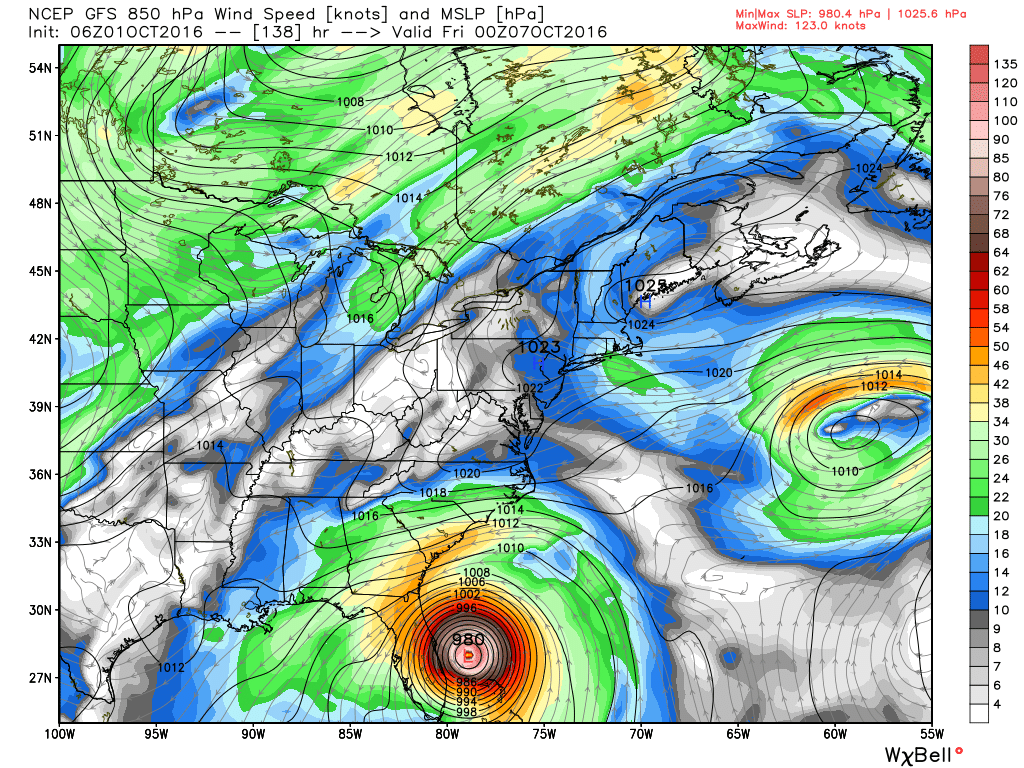
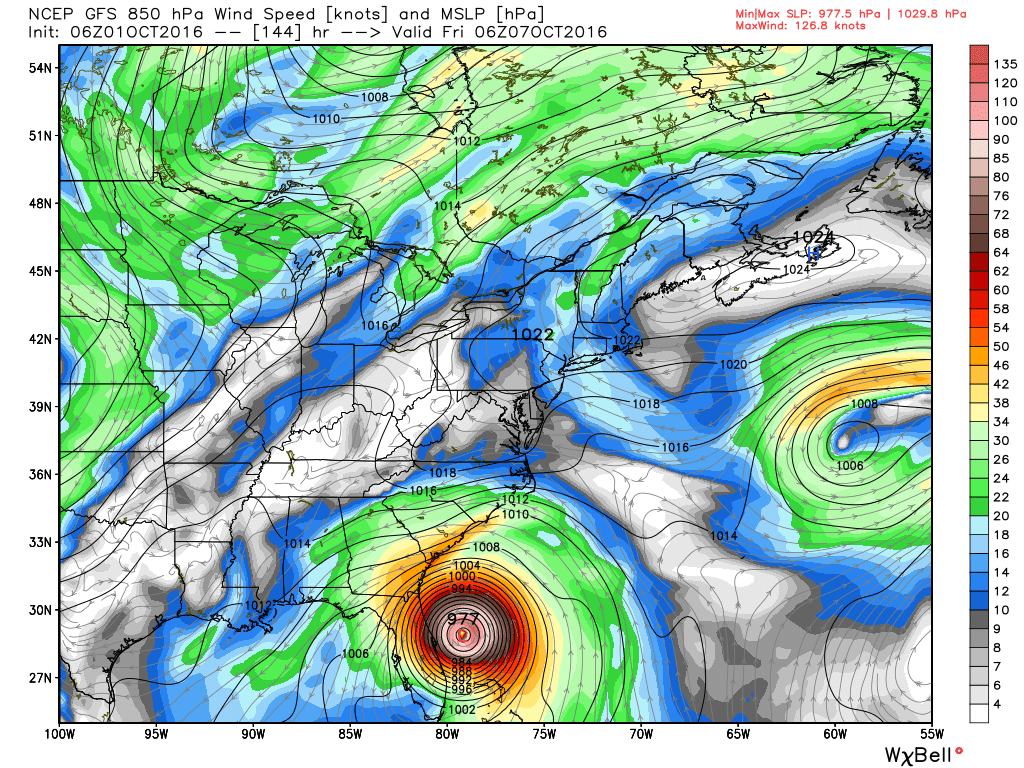
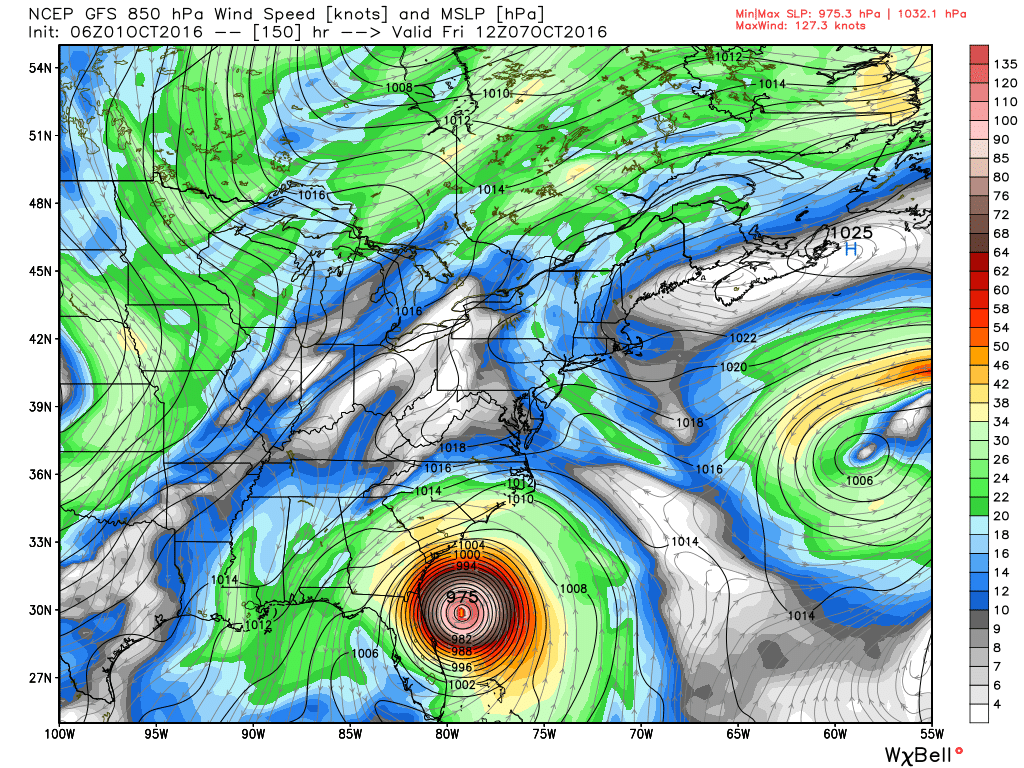
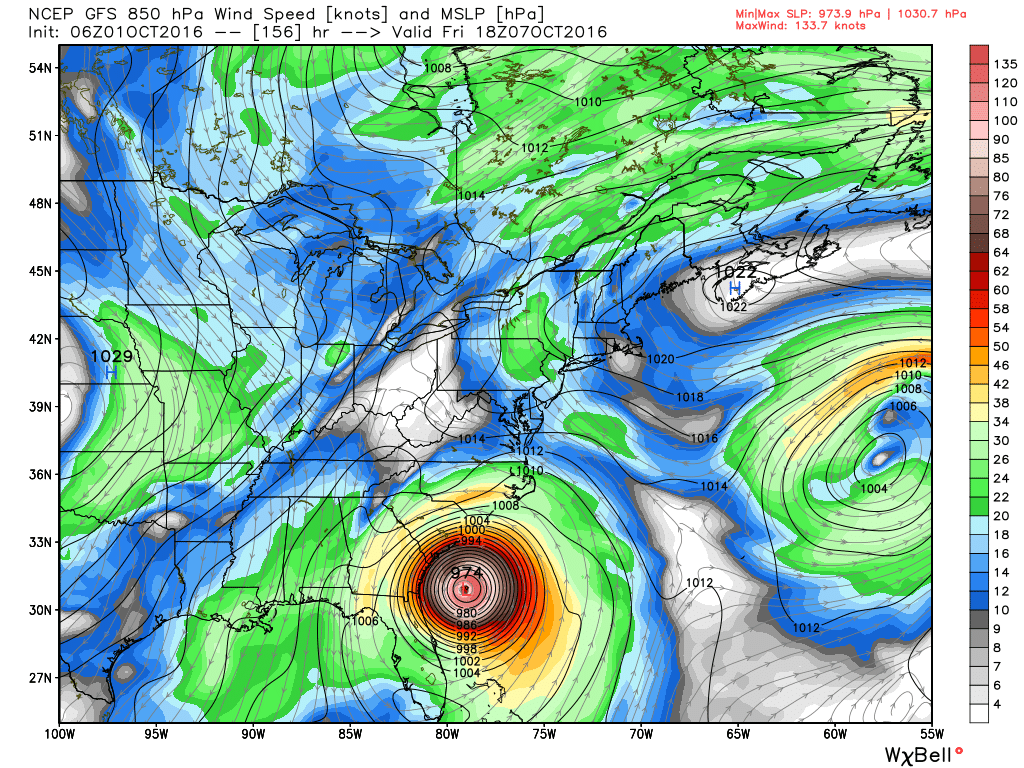
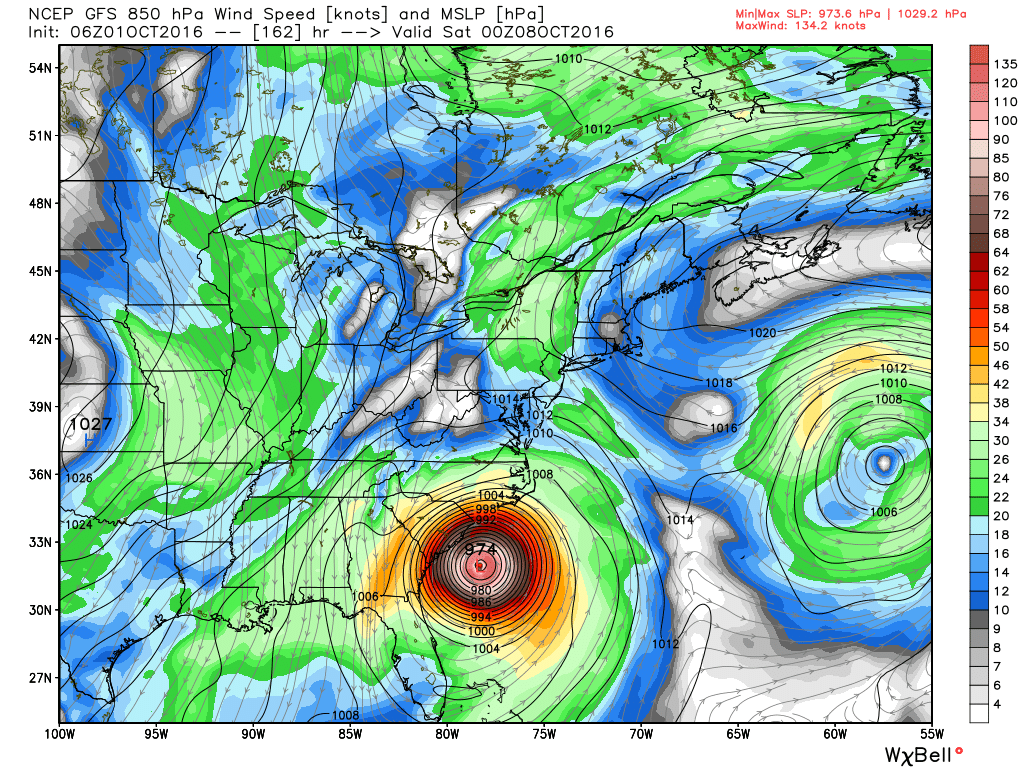
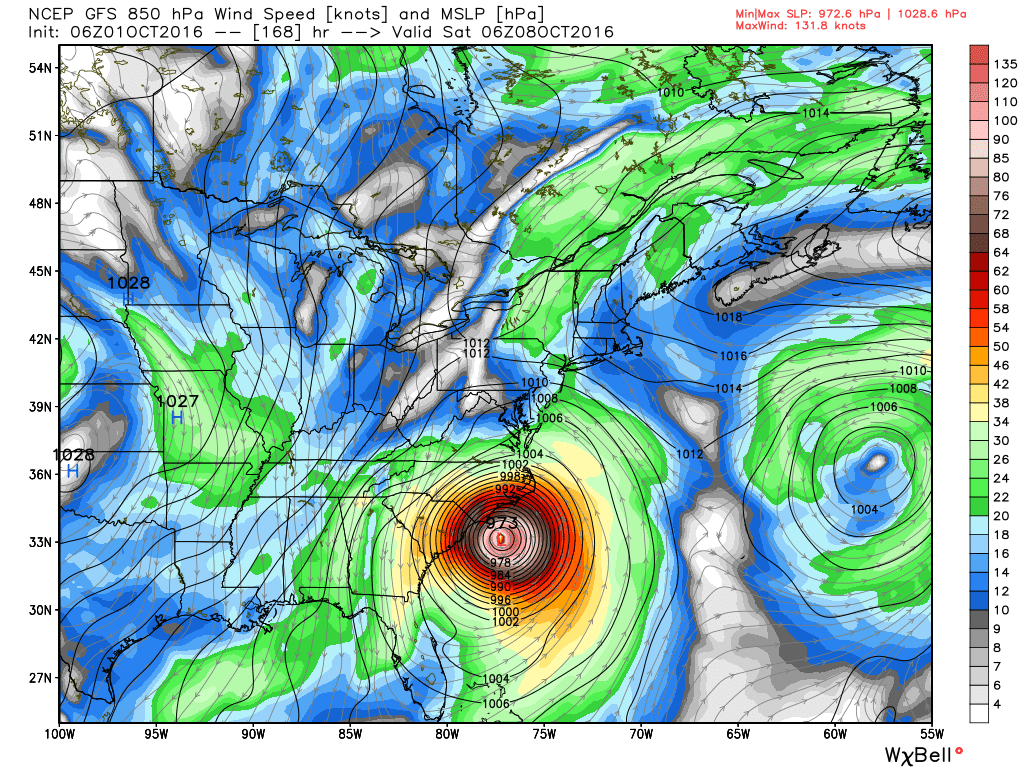
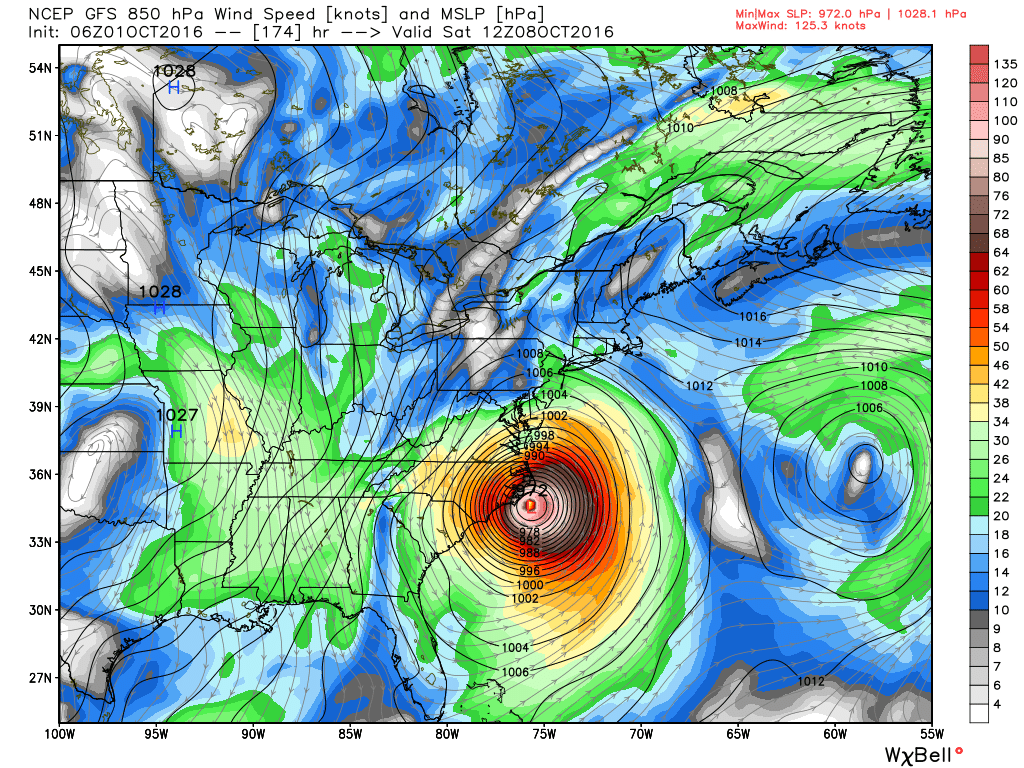
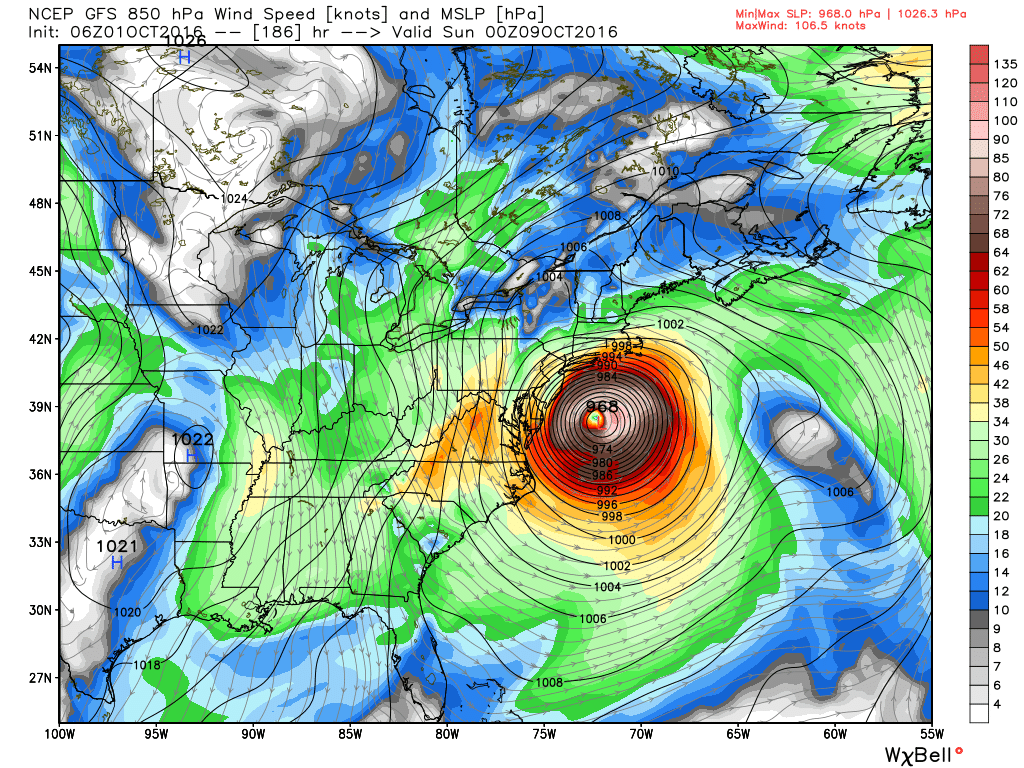
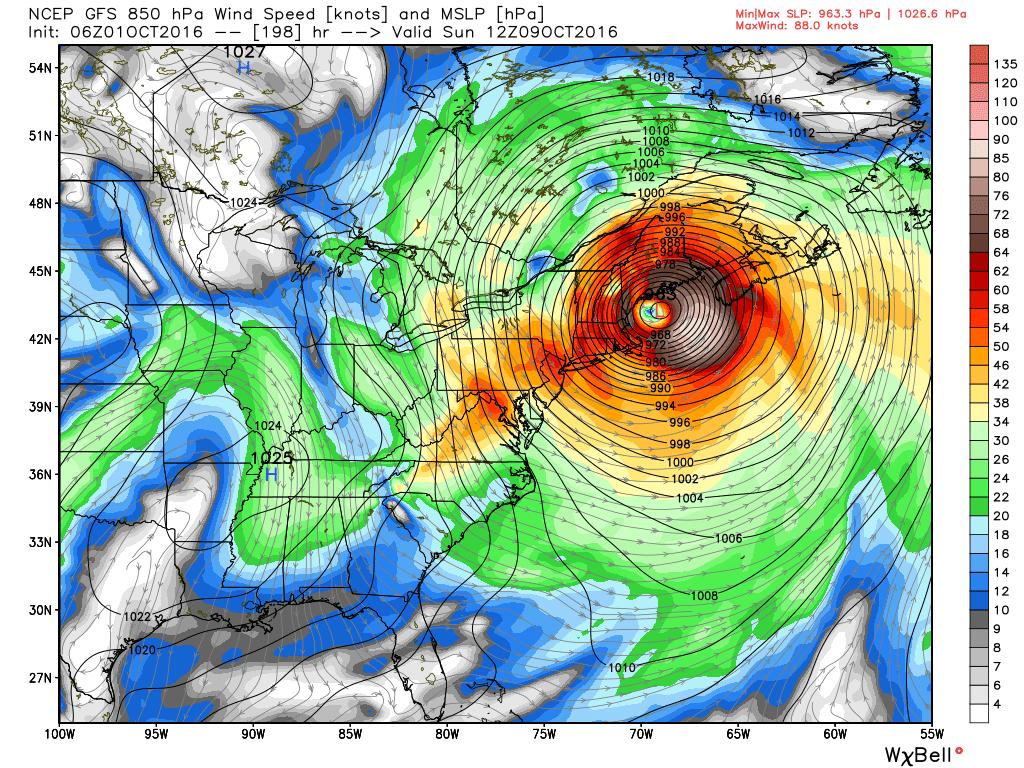
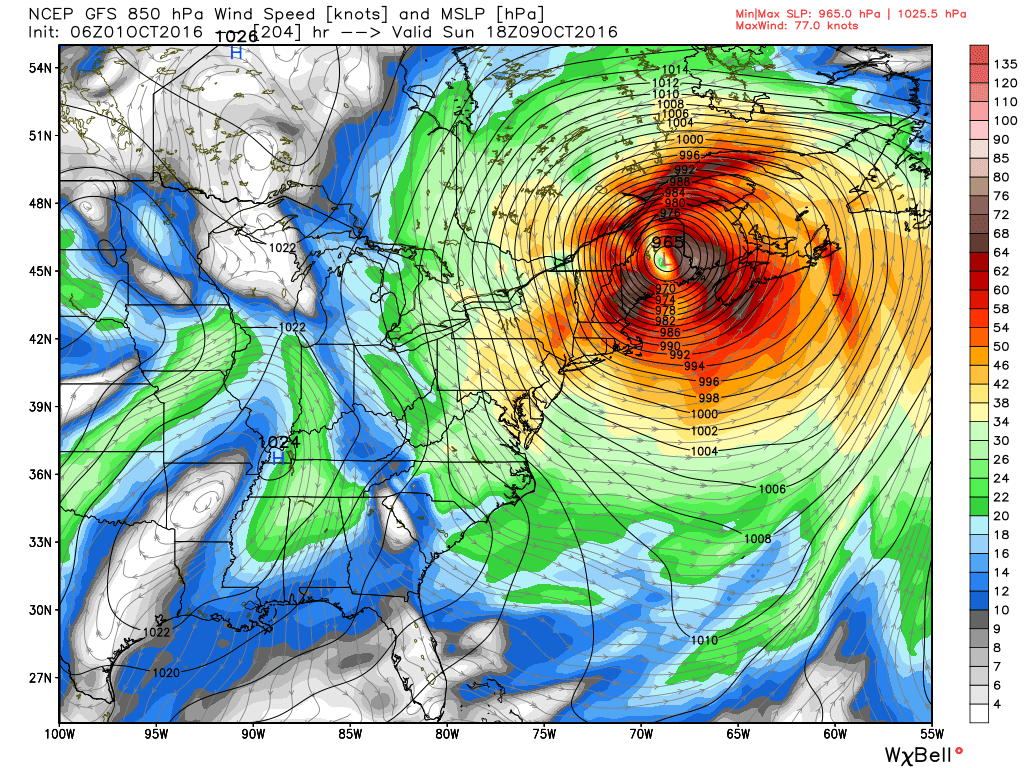
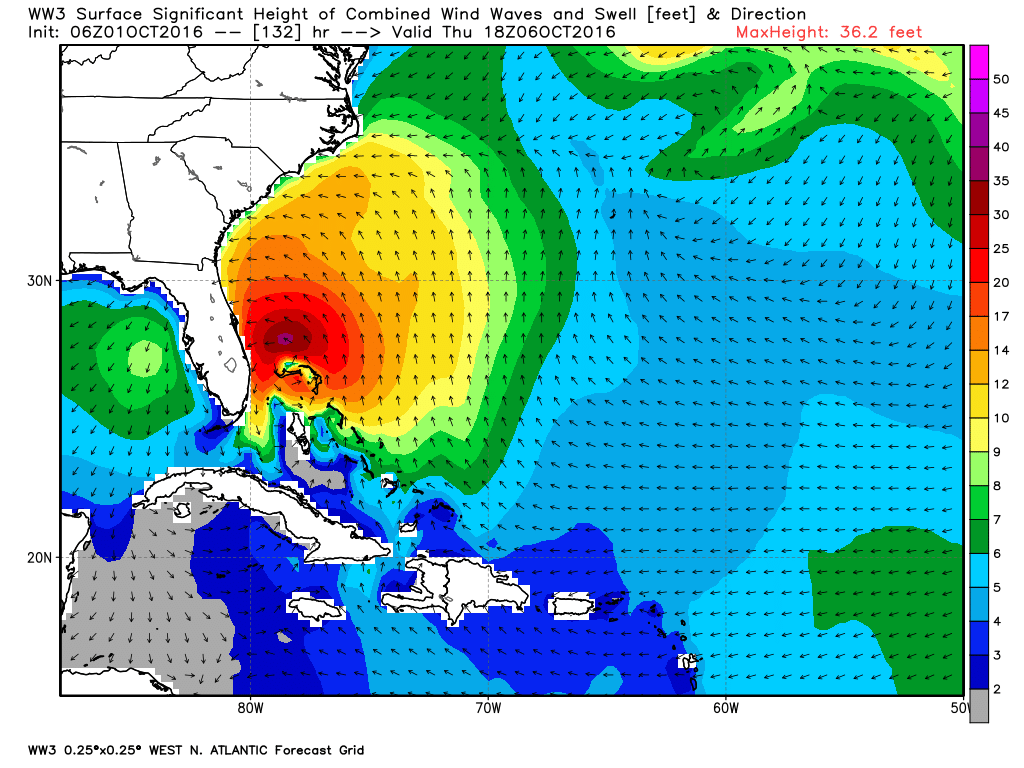
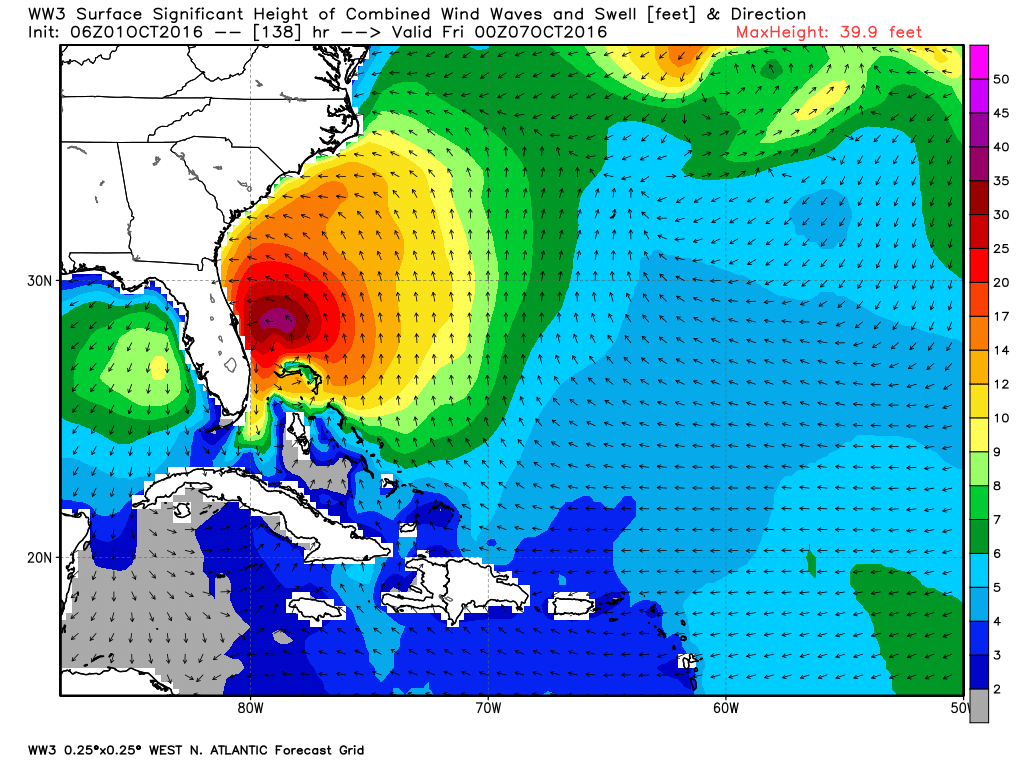
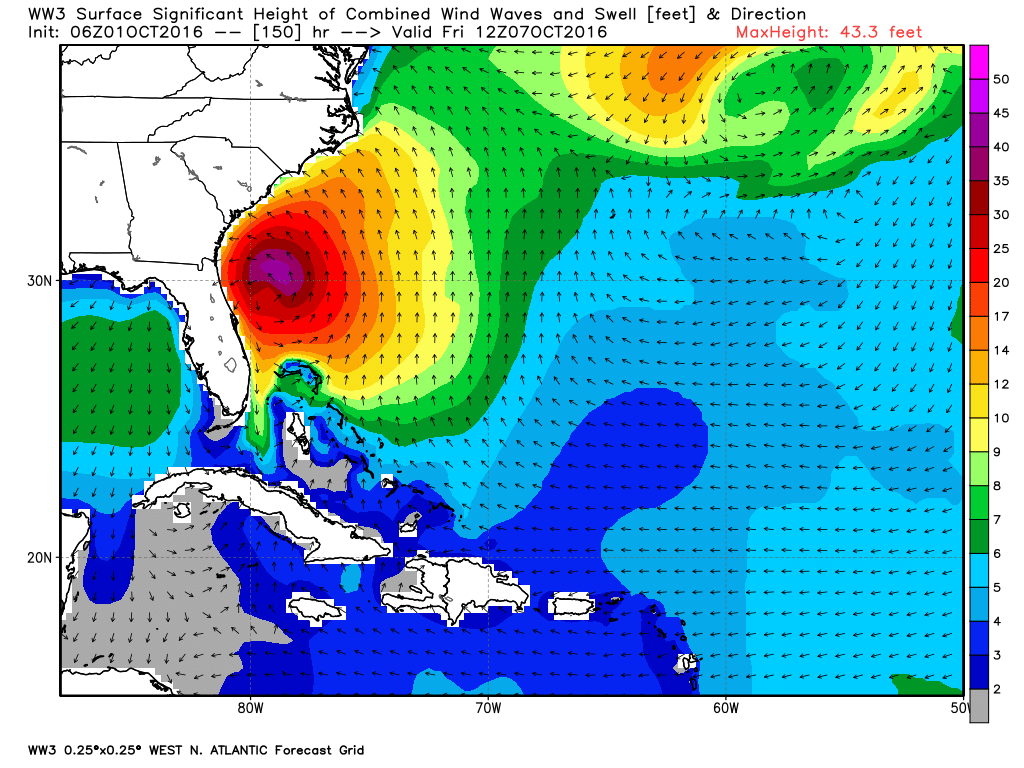
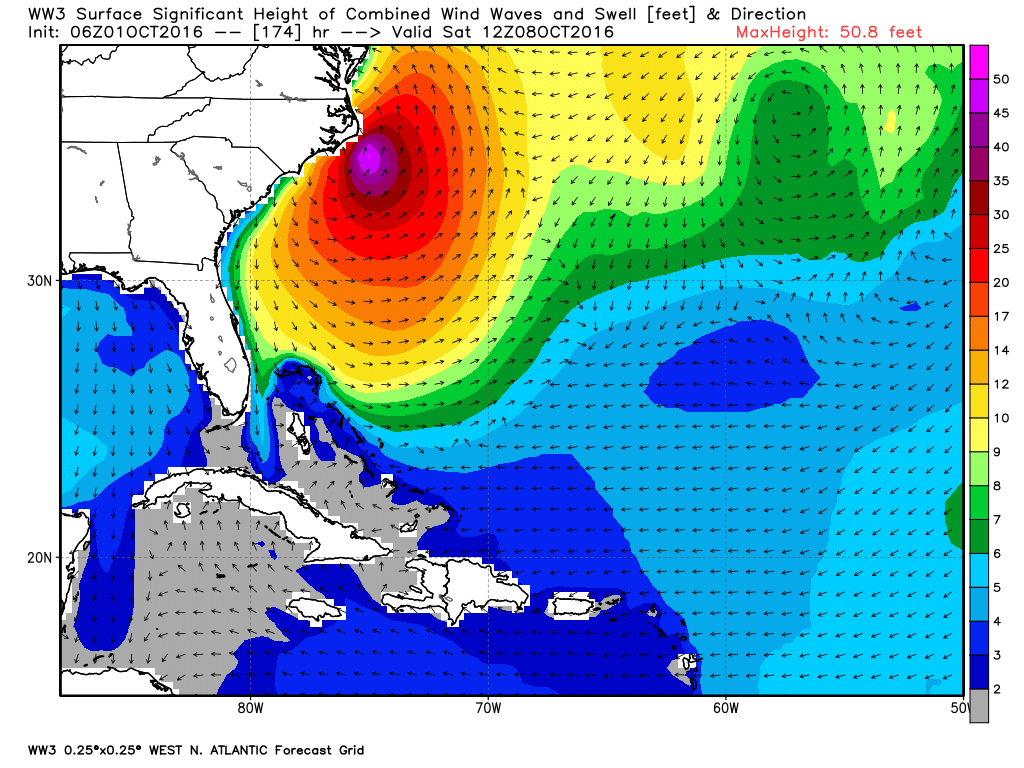
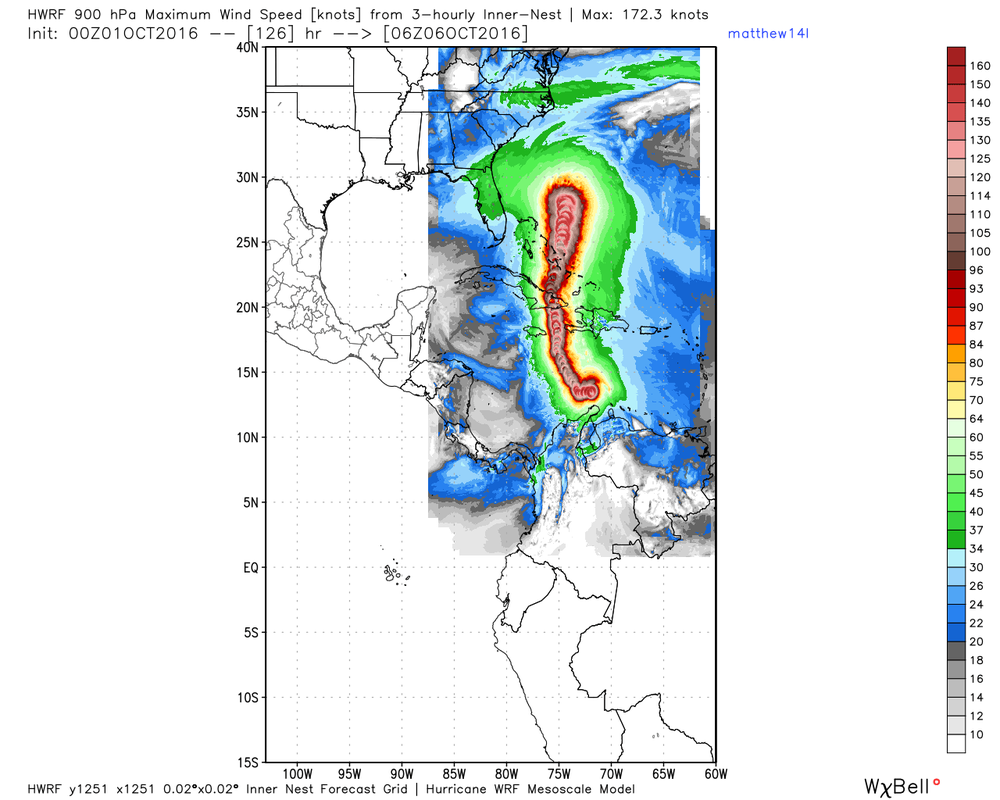
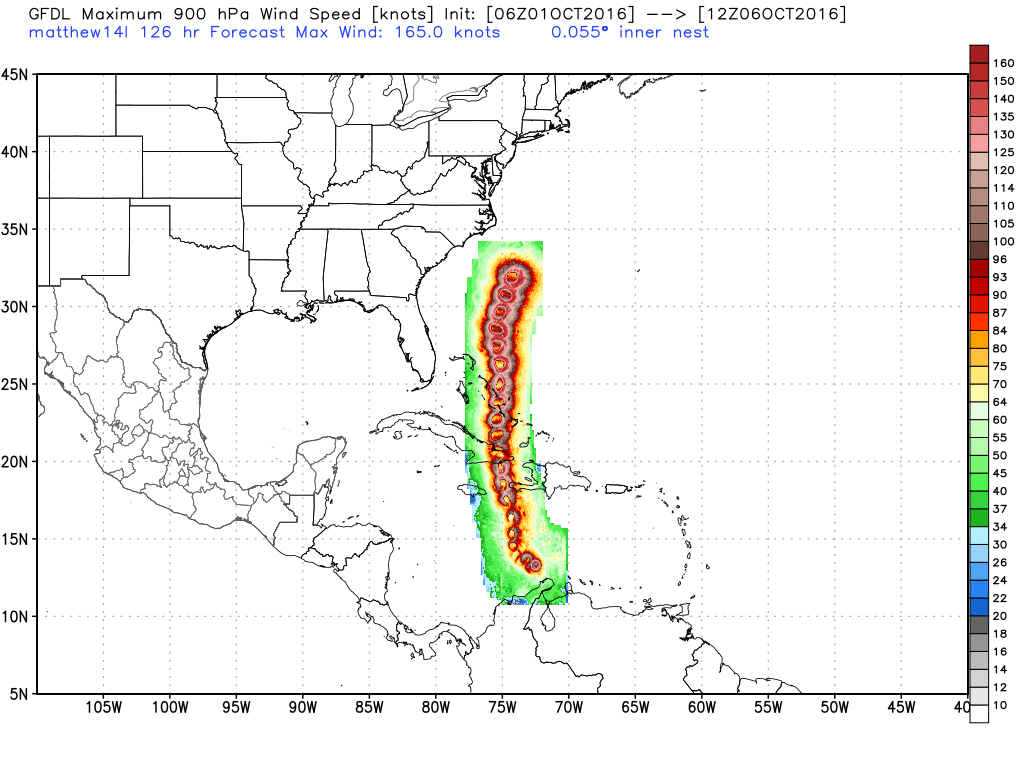
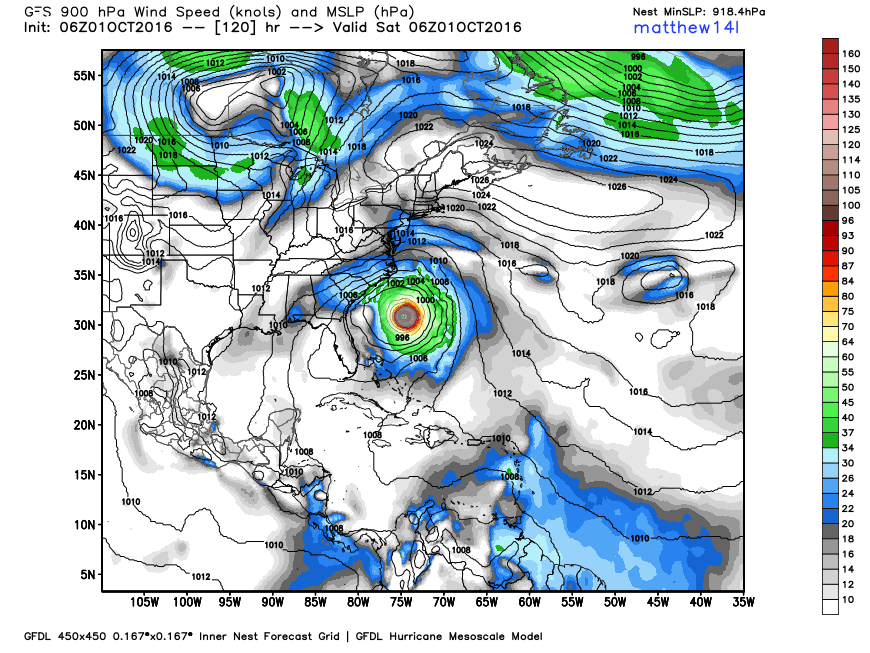
The GFS operational run mimics the ensembles and brings the hurricane right up the eastern US coast in what would be the most disastrous path that a hurricane could possibly take. Last night Joe Bastardi said the the only hurricane to do that was Hurricane Donna in 1960. I've included the GFS maps every 6 hours so you can see for yourself how bad this potential scenario would be to a densely populated and very vulnerable area. These are 850 mb wind speed and MSLP. (All images WeatherBELL) And the bad part is that nothing has changed this morning, these are from the latest model run. Wave ActionTo really show why this would be so bad for the coast, take a look at the wave height and direction. The model shows 40 foot waves just off shore, with the waves to the north of the hurricane moving almost perpendicular to the shore, in other words, moving in a straight line toward the beaches. This would create a tremendous storm surge that would travel up the entire east coast. The forecast only goes out this far, but the track would continue to take it right along the shoreline all the way to Maine. Other ModelsHere's a look at a few of the other models with out comment.
The main reason for the big differences is the timing and the strength of the trough over the northern US. That trough, in the right location, will pull the hurricane toward it. If the trough is weaker, the hurricane is not pulled east as much, or if the timing is off and the trough misses the hurricane... lots of scenarios and no concrete answers yet. By tomorrow we'll know which model, the Euro or GFS, was correct.
|
Archives
March 2019
Categories
All
|
OLD NORTH GA WX BLOG


 RSS Feed
|
Never base important decisions on this or any weather information obtained from the Internet. Always have a backup method of receiving weather information such as a battery powered weather radio.
Copyright © 2018 NorthGeorgiaWX.com and DaculaWeather.com 
|