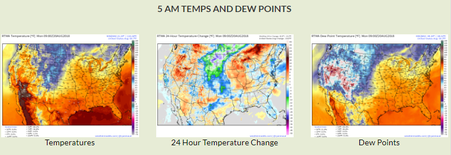
 I wrote a long Facebook post this morning about this topic only to have Facebook tell me they are having issues, and of course losing everything I wrote. I should complain but what good would it do, I know better than to trust Facebook with anything I do so I can only blame myself. So... let's try this again. The "Weather on This Date" is split into three main sections, the text part of WOTD at the top of the post, a section called "TODAY'S WEATHER SUMMARY", and a section called "TODAY'S FORECAST". In the "TODAY'S WEATHER SUMMARY" section is a group of three images titled "5 AM TEMPS AND DEW POINTS", and that section is the topic of this post. I picked 5 am randomly with no specific reason in mind other than I wanted to choose a consistent time before sunrise, and this just happens to be what I picked. All of these images come from Dr. Ryan Maue's new model website at https://weathermodels.com/ 5 AM Temperatures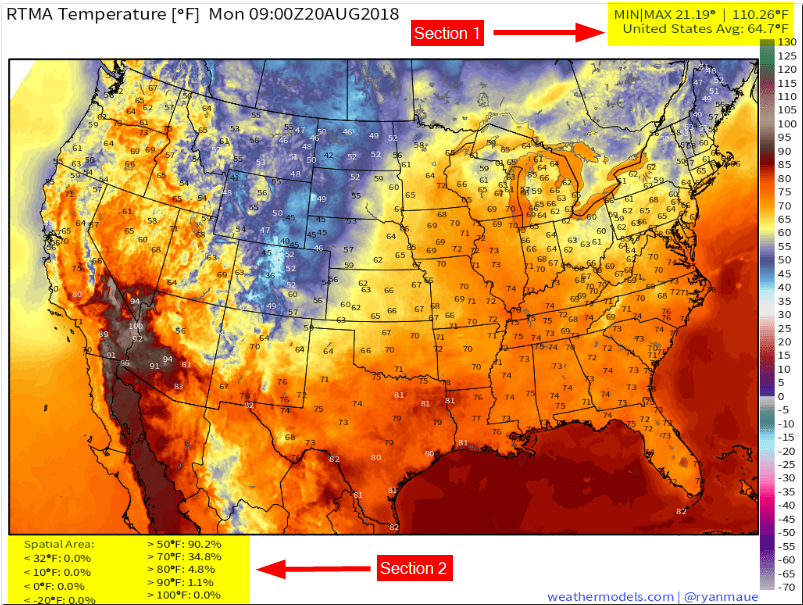 This is a look at the 5 AM temperatures, and I use the 5 am time period each day. Besides the map itself, there are two areas to focus on.
24 hour Temperature Change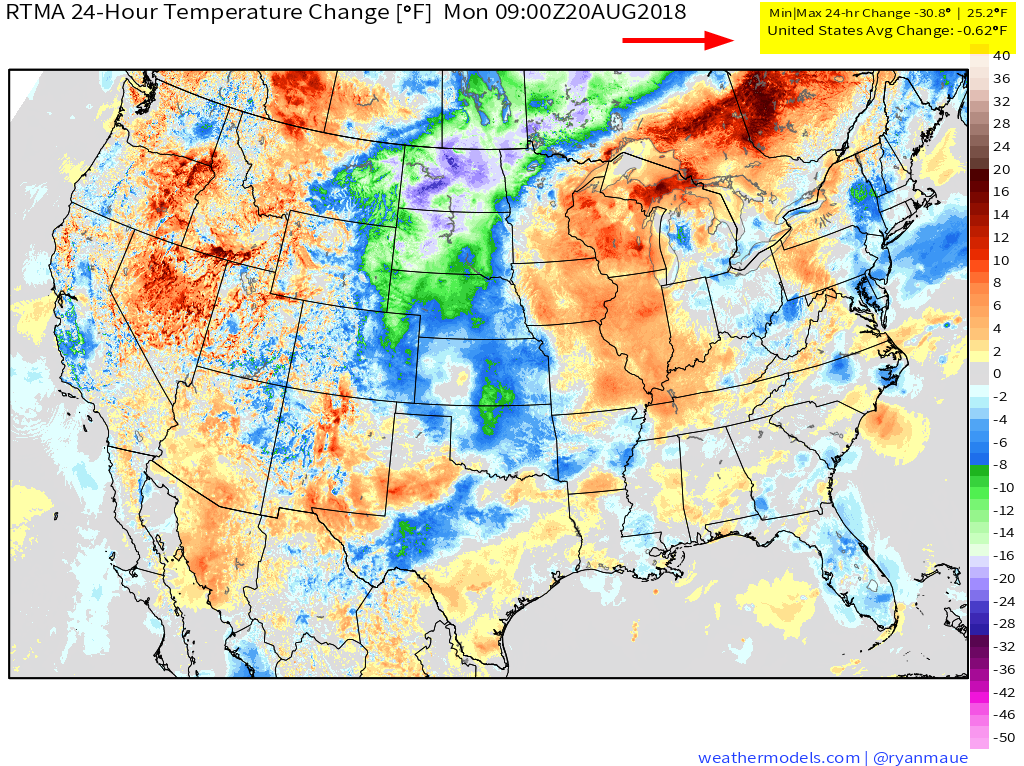 I like this map as it shows the average temperature trend for the entire county. If you watch this on a daily basis, you can see how the temperatures slowly start trending down after the hottest day of summer passes.
Dew Points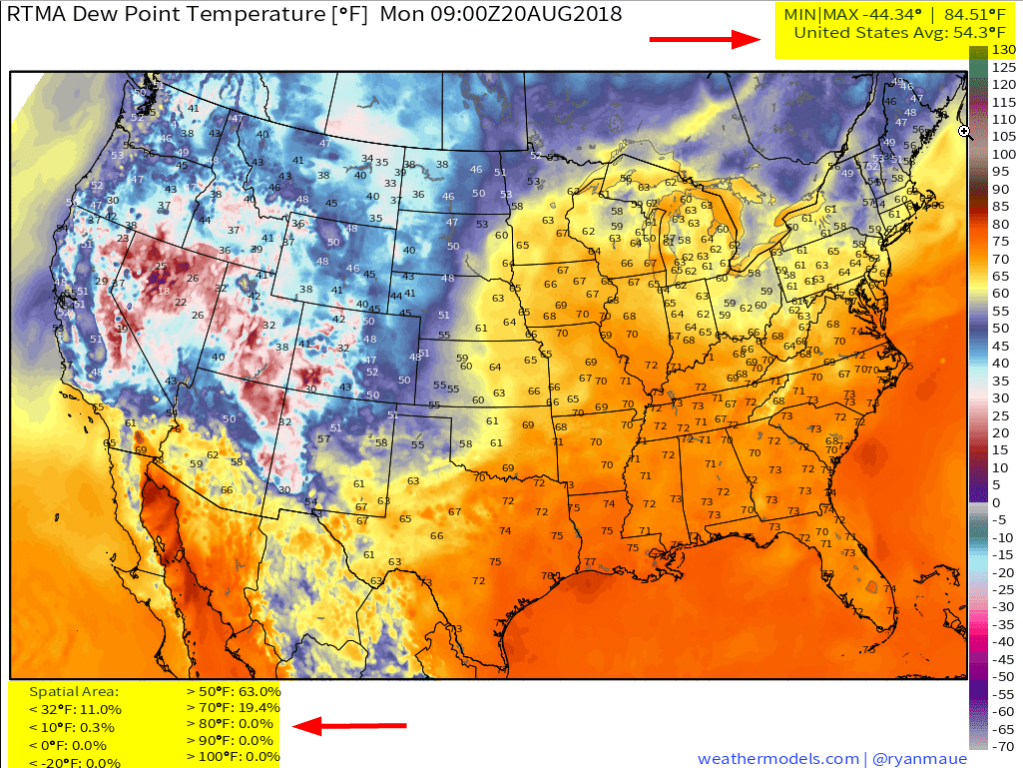 Like the temperature image, this one has two sections with additional data.
Tomorrow, I'll focus on the three WOTD images that precede these in the same section. |
Archives
March 2019
Categories
All
|
OLD NORTH GA WX BLOG
 RSS Feed
|
Never base important decisions on this or any weather information obtained from the Internet. Always have a backup method of receiving weather information such as a battery powered weather radio.
Copyright © 2018 NorthGeorgiaWX.com and DaculaWeather.com 
|