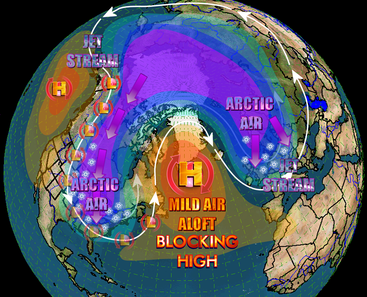
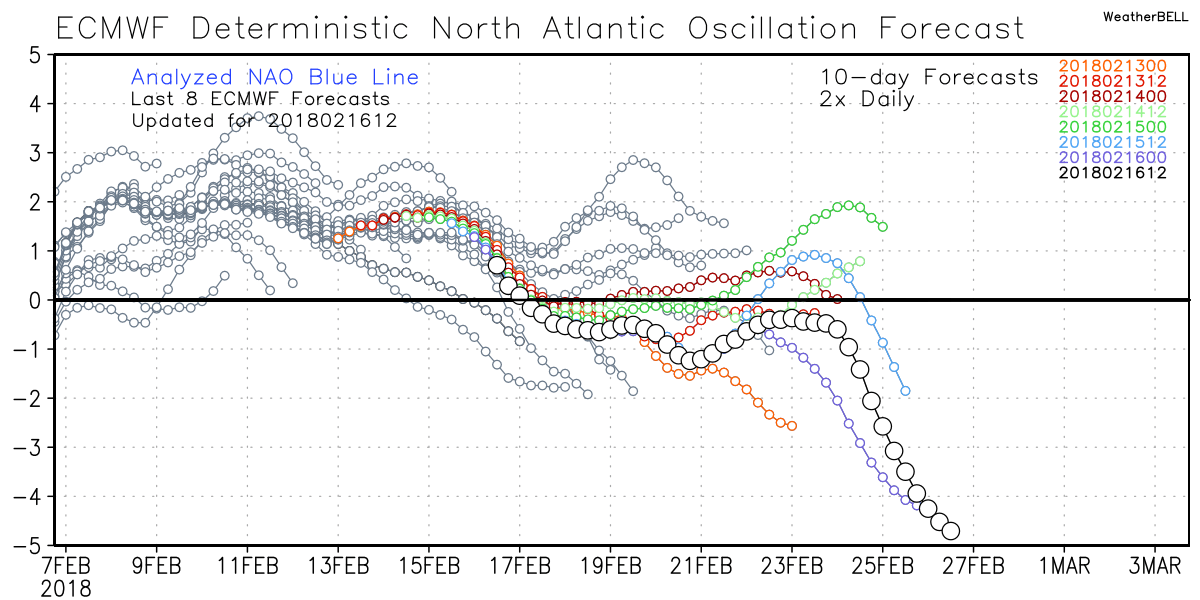
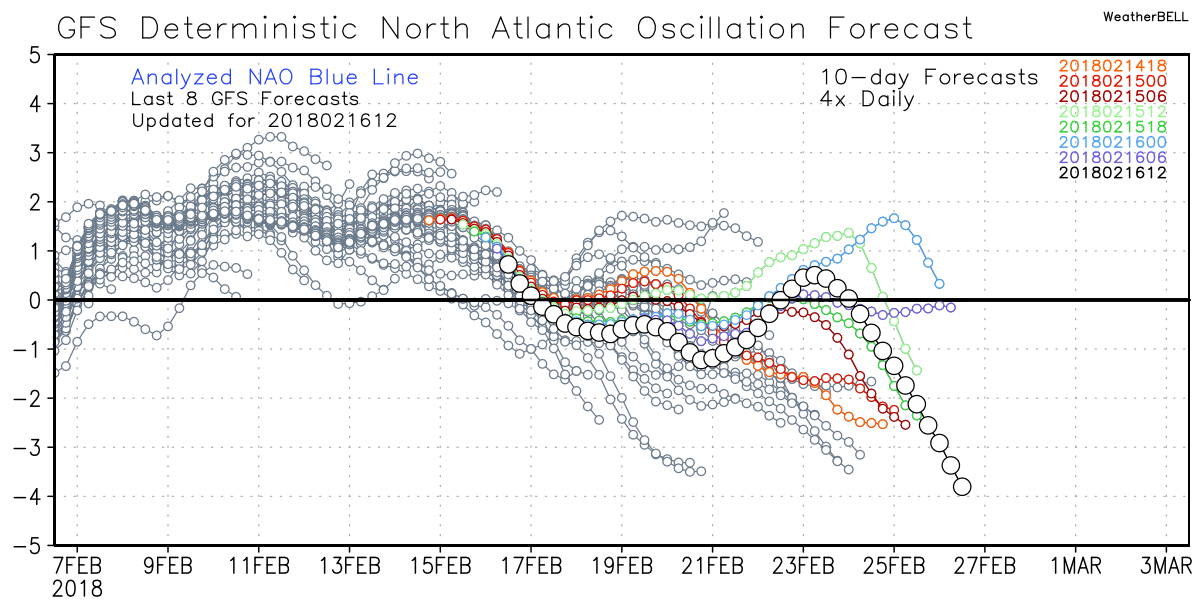
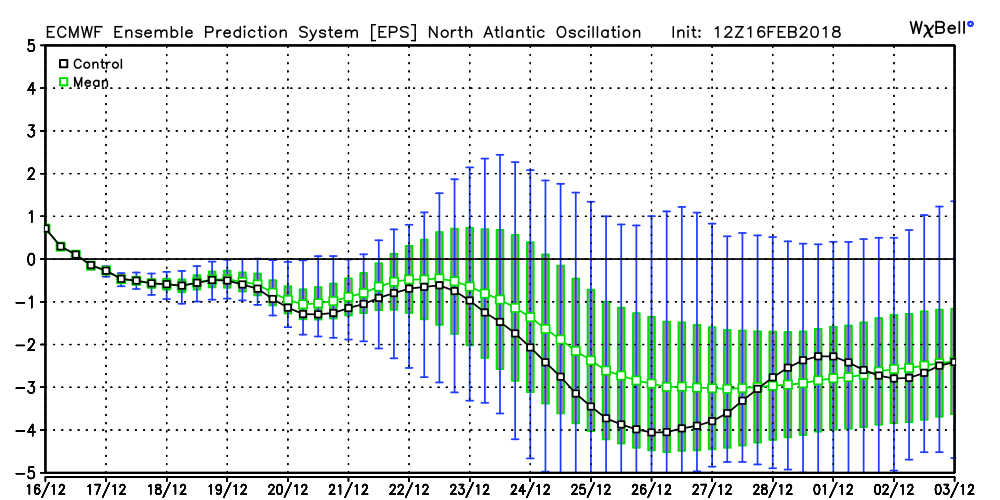
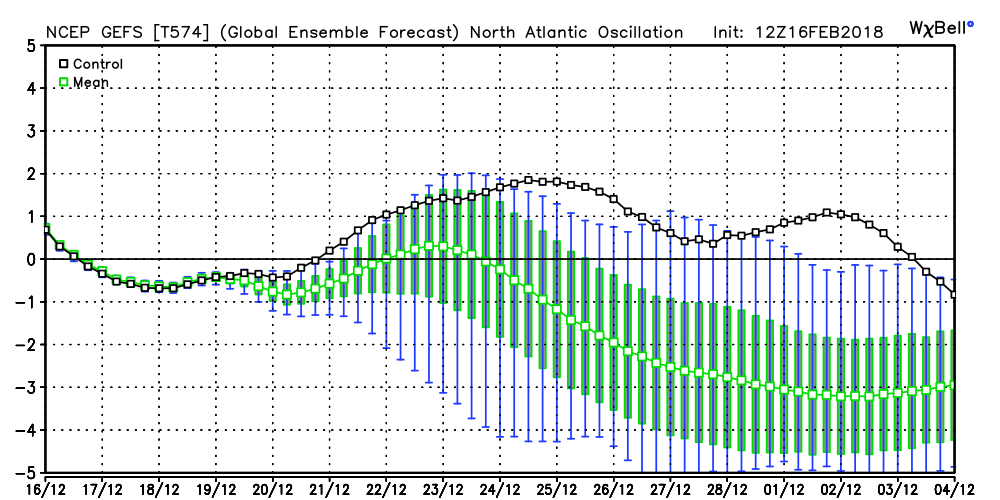
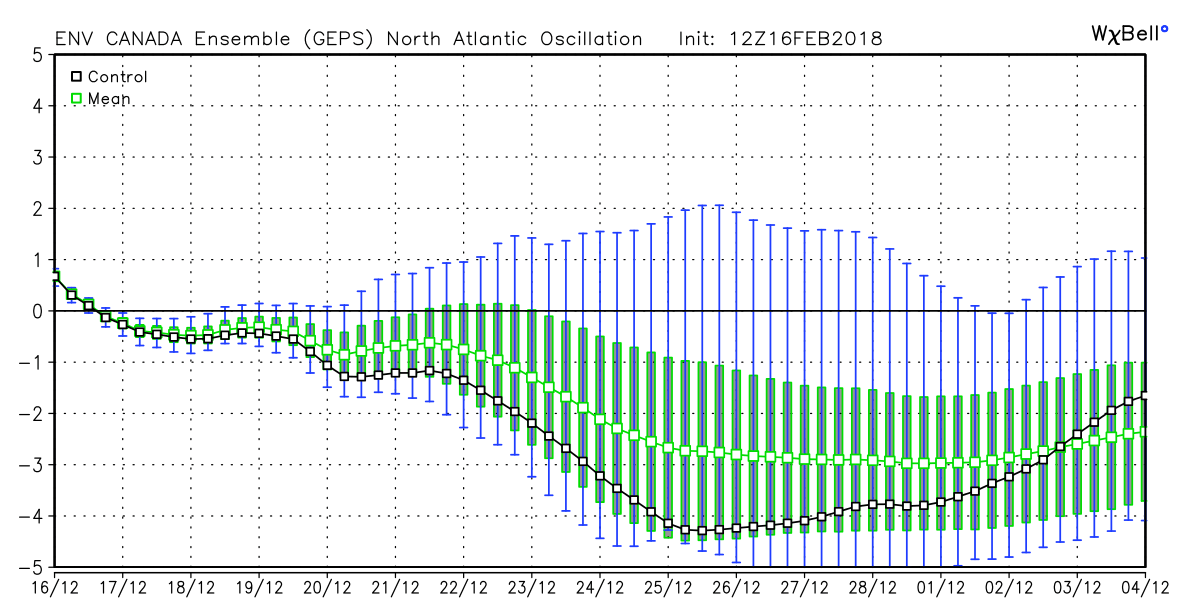
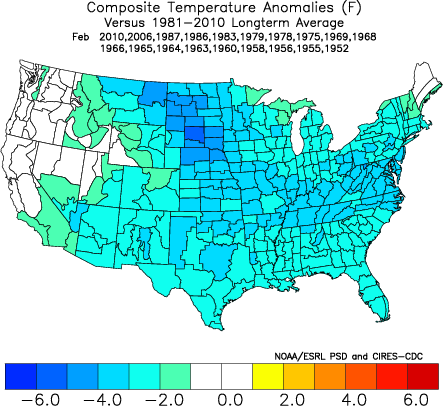
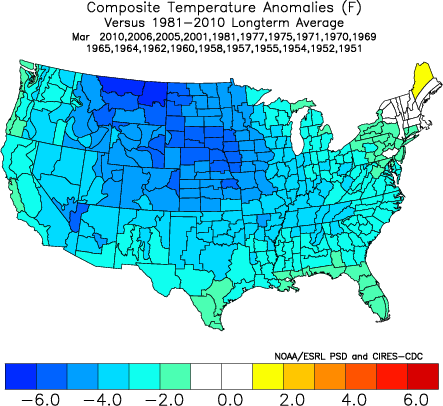
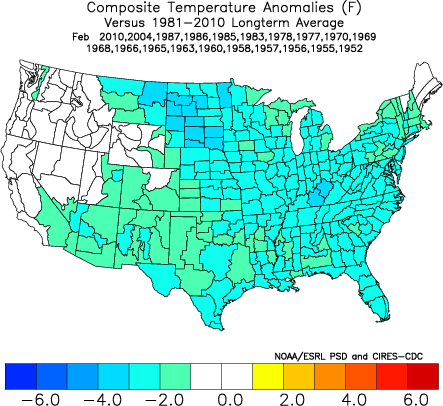
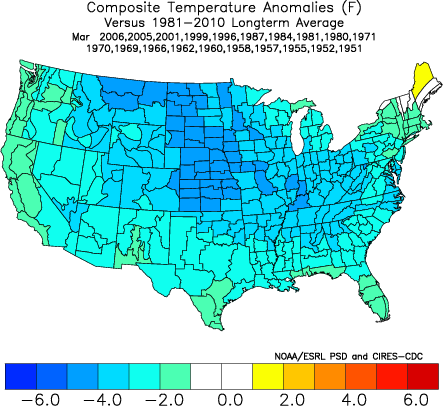
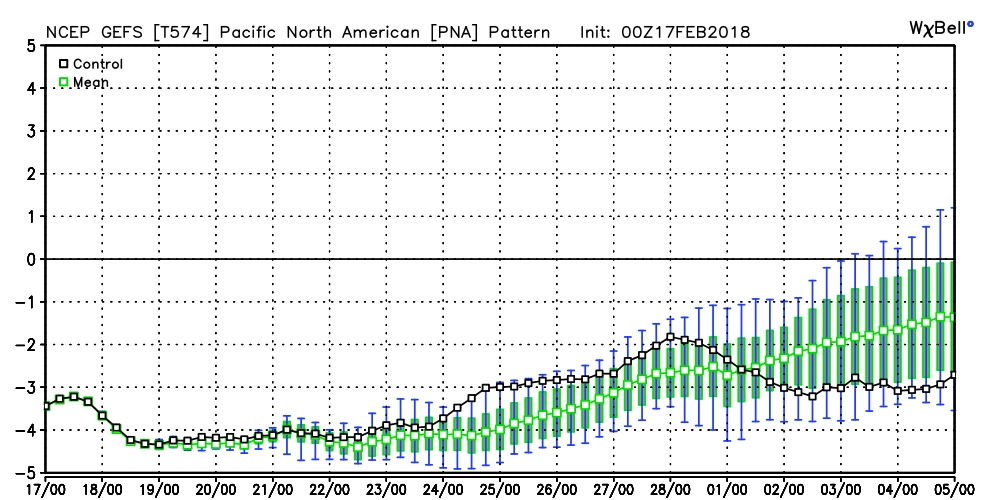
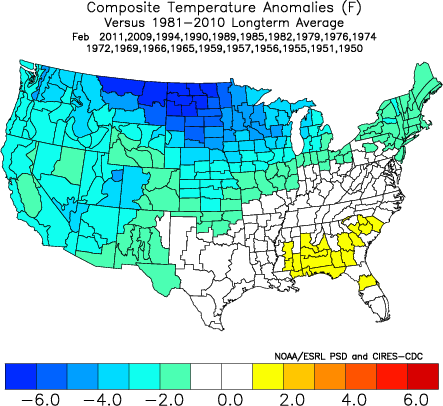
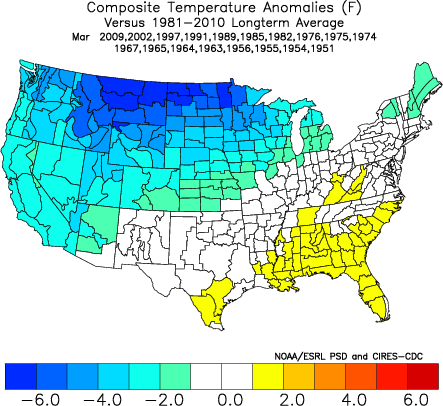
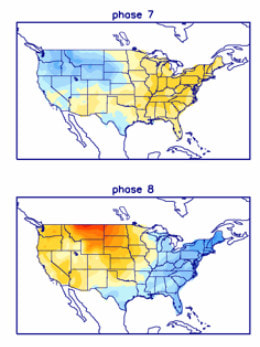
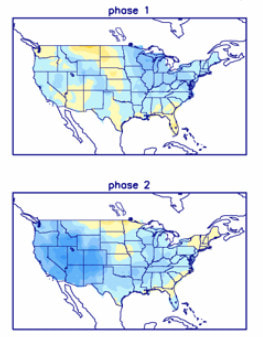
 Example of a Negative NAO - click to enlarge Example of a Negative NAO - click to enlarge All models are in very good agreement about the state of some very important teleconnections as we head toward the end of the month, and I wanted to show you some examples of what I'm talking about. The talk right now is how the NAO or North Atlantic Oscillation, is about to take a negative plunge. "The North Atlantic Oscillation (NAO) is a weather phenomenon in the North Atlantic Ocean of fluctuations in the difference of atmospheric pressure at sea level (SLP) between the Icelandic low and the Azores high." The negative phase of the NAO reflects above-normal heights and pressure across the high latitudes of the North Atlantic and below-normal heights and pressure over the central North Atlantic, the eastern United States and western Europe. The image above shows a NAO block. I'll first show you what the models are depicting and then I'll show you the analog results of that for February and March. You can thank the Sudden Stratospheric Warming event for he steep decline in the Arctic Oscillation (AO) and NAO values. We need a little more cooperation from the EPO or East Pacific Oscillation to add the icing on the cake. Or who knows... maybe white stuff on the ground? :-) The first two images are the Euro and GFS operational models from the 16th. The Euro is diving off the charts negative with the GFS not far behind. The images below are the ensemble runs of the three major models for the NAO. The darker line in each image is the control run, the center green line is the ensemble mean. The taller green bars show the spread of the ensemble members. As you can see, the ensemble members for all models agree on a very negative NAO in our near future. The images below show the "normal" temperature outcomes with a negative NAO in February (left) and March (right) 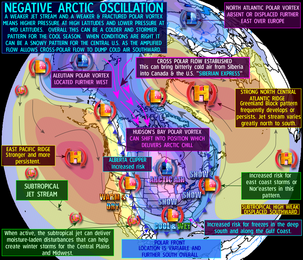 Example of a Negative Arctic Oscillation - click to enlarge Example of a Negative Arctic Oscillation - click to enlarge As long as we're talking about the Arctic Oscillation, here's a broad brush look at an example of a negative AO. In the negative phase, the polar low pressure system (also known as the polar vortex) over the Arctic is weaker, which results in weaker upper level winds (the westerlies). The result of the weaker westerlies is that cold, Arctic air is able to push farther south into the U.S., while the storm track also remains farther south. The opposite is true when the AO is positive: the polar circulation is stronger which forces cold air and storms to remain farther north. The Arctic Oscillation often shares phase with the North Atlantic Oscillation (NAO), and its phases directly correlate with the phases of the NAO concerning implications on weather across the U.S. The two images below show the outcome of a negative AO for February (left) and March (right). There are other teleconnections that aren't quite as favorable, and the PNA is one of those. Right now it's fairly deep in the negative range, and you can see from the two images to the right, that makes things a little warmer here at this time of year. 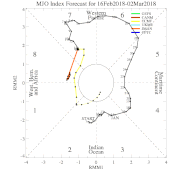 MJO all model mean MJO all model mean We've been stuck in Phase 7 of the MJO which is a warm phase for us at this time of the year, but it looks like it will start moving into Phase 8, 1, 2, even if only weakly. Phases 6 and 7 which we just went though are warm phases during the winter months, and the strength of the amplitude made things even worse. The 8, 1, 2 phases are cooler than the one we are currently in The combination of favorable high latitude blocking and the MJO should allow for the return of cold air for the month of March. The main concern will be how much Pacific air we get and how much the Bermuda ridge wants to flex its muscle. |
Archives
March 2019
Categories
All
|
OLD NORTH GA WX BLOG
 RSS Feed
