|
This is the first of what I hope will be many post on significant weather events in Georgia. Almost all of this information comes from the NWS and NOAA and I take no credit for the documentation, my goal was to compile all of the information from multiple sources, and bring it together in one place. PrefaceA decaying tropical system, previously known as Tropical Storm Alberto, produced torrential rainfall which resulted in some of the worst flooding ever observed across portions of the States of Georgia, Alabama, and Florida during July 1994. The rainfall led to exceptional flooding across central and western Georgia, eastern Alabama, and the Florida Panhandle. Five river basins were particularly hard hit: (1) the Flint River Basin in western Georgia, (2) the Ocmulgee River Basin in central Georgia, (3) the Chattahoochee River Basin along the Georgia-Alabama state line, (4) the Choctawhatchee River Basin in Alabama, and (5) the Apalachicola River Basin in Florida. The flooding claimed 33 lives and caused damages estimated at close to $750 million. ANational Oceanic and Atmospheric Administration (NOAA)disaster survey team assembled for its first meeting in Peachtree City, Georgia, on the morning of July 18, 1994. All aspects of weather and flood warning systems--from data acquisition to user response--were surveyed to determine NOAA's effectiveness and to recommend improvements if deficiencies were found. This report gives the results and findings of the survey team. The survey team consisted of the following individuals:
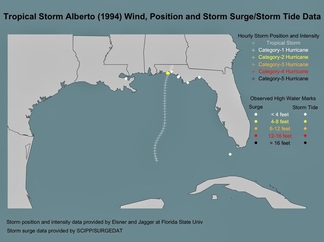
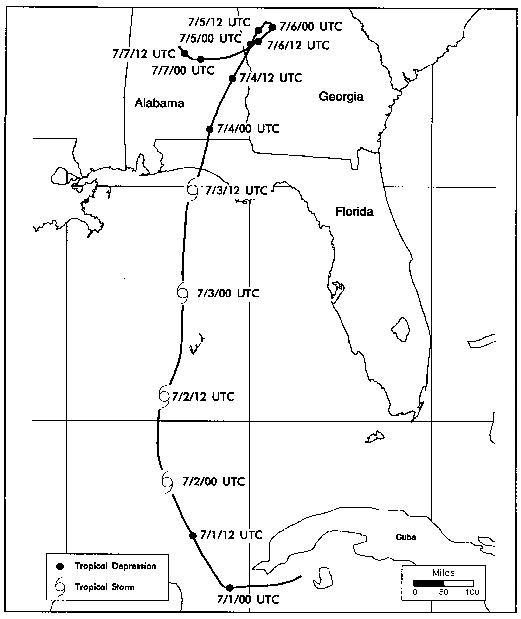
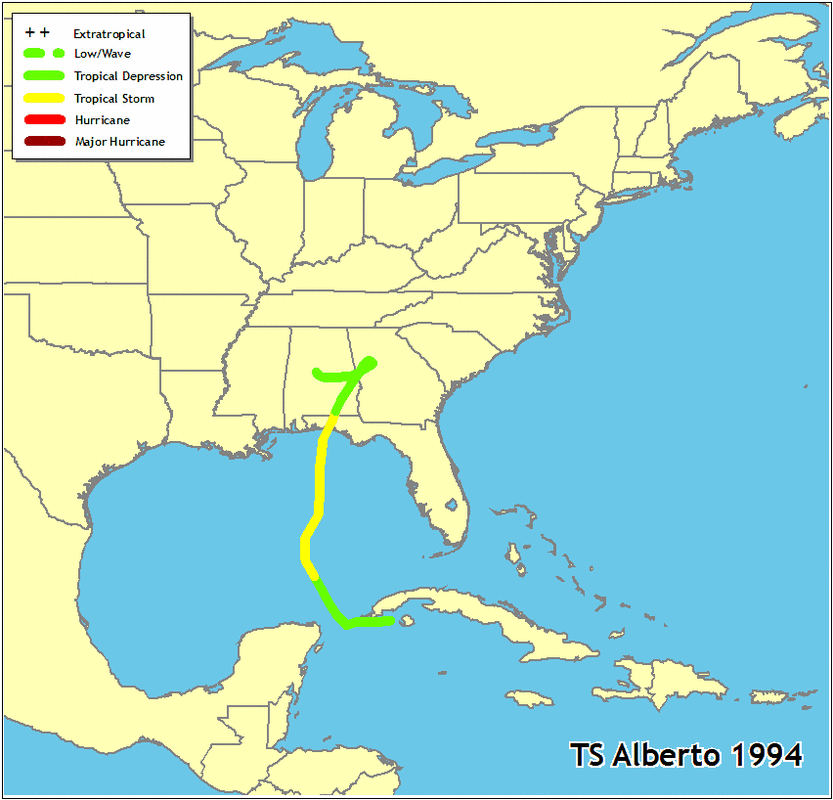
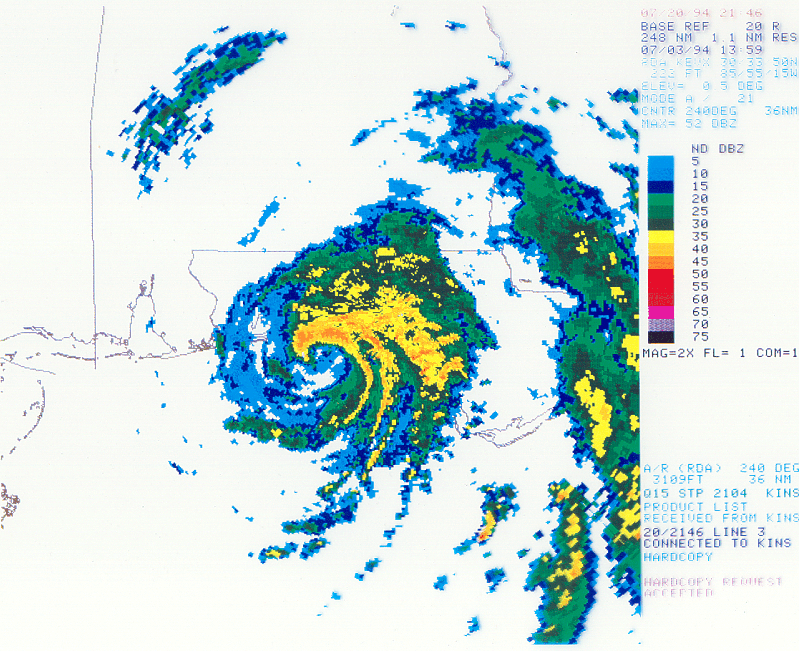
The team was divided into two groups during parts of the survey so that the wide geographic area of impact could be covered efficiently. One group, composed of Alex, Georgakakos, and May, traveled through Georgia and the eastern portion of the Florida Panhandle. The other group, composed of Haffer, Hooke, and Van Demark, concentrated on Alabama and the western portion of the Florida Panhandle. During the week, the two teams coordinated their progress by meetings and telephone calls. The survey team conducted its field work on Monday, July 18, through Friday, July 22, 1994. The entire survey team met in Atlanta, Georgia, on Saturday, July 23, 1994. The consensus of the survey team was that overall NOAA provided good, high-quality services throughout this event. The report discusses successful features of NOAA's services program, as well as recommendations for areas needing improvement. William H. Hooke Team Leader Summary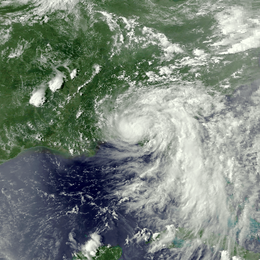 Tropical Storm Alberto originated in Senegal on June 18, 1994, as a tropical wave. The system became Tropical Depression One on June 30 at approximately 0600 Universal Coordinated Time (UTC). On July 2 at about 0000 UTC, the depression strengthened in the Gulf of Mexico near the Yucatan Peninsula to become Tropical Storm Alberto. When the center made landfall near Destin, Florida, at 1500 UTC on July 3, Alberto was at its peak intensity, 993 millibars and 55-knot winds. Winds then quickly subsided, and Alberto's central pressure rose rapidly. After landfall, the motion of the storm slowed and precipitation increased. The storm moved slowly through Alabama into Georgia, stalling just south of Atlanta. Over the next few days it reversed its course and then looped back on its previous course before ultimately dissipating. During that period it dumped copious amounts of rain across the area. Amounts as high as 21.1 inches in 24 hours were observed at Americus, Georgia. The Weather Surveillance Radar-1988 Doppler (WSR-88D) provided the forecasters with a very good representation of the areal extent of the precipitation although it underestimated precipitation amounts somewhat. This rainfall produced record and near-record flooding along the Flint, Ocmulgee, Chattahoochee, Choctawhatchee, and Apalachicola Rivers )see image). Overall, flash flooding and flooding caused by the rainfall from Alberto took 33 lives, destroyed thousands of homes (including some entire communities), forced approximately 50,000 people to be evacuated, and caused property damage (including lost crops) estimated as high as $750 million. Impact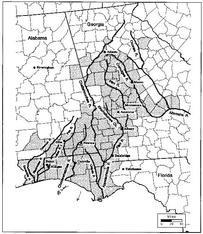 Figure 1-2 Click to enlarge Figure 1-2 Click to enlarge Figure 1-2 shows the counties that were Presidentially declared disaster areas. Most of the declared counties were concentrated along the five rivers (and their tributaries) mentioned in the section above. A total of 78 counties were declared Federal disaster areas, including 55 in Georgia, 10 in Alabama, and 13 in Florida. The flooding took a significant toll on human life, as a total of 33 persons perished. Of that total, 31 deaths occurred in Georgia, while the other 2 occurred in Alabama. Many of the fatalities, as is typical with flood events, occurred as a result of flash flooding; and most occurred in vehicles. In addition, approximately 50,000 people were forced from their homes due to the flooding. More than 18,000 dwellings were damaged or destroyed by the floods, and nearly 12,000 people applied for emergency housing. In Macon, Georgia, the fresh water supply to nearly 160,000 people was disrupted when the water treatment plant, located along the banks of the Ocmulgee River, was flooded. Some residences were without fresh water for as long as 19 days. In addition, thousands of people and pieces of equipment were engaged in various flood-fighting efforts throughout the three-state area impacted by the flooding. Dozens of Federal, state, and local government agencies, private organizations, as well as various volunteer groups, were heavily involved in the massive mobilization of resources. Federal agency participation included, but was not limited to, the Federal Emergency Management Agency (FEMA) , U.S. Army, U.S. Army Corps of Engineers, U.S. Department of Transportation, U.S. Department of Housing and Urban Development, and Small Business Administration. With respect to property damages, the estimates are nearly $750 million across the States of Georgia, Alabama, and Florida as a result of this flood event. In addition to the more than 18,000 dwellings damaged or destroyed, hundreds of bridges and well over 1,000 roads sustained damages. Also, 218 dams (most of them small dams located in Georgia) were damaged by the flooding, many of which failed altogether. Agricultural losses accounted for approximately $100 million. In the States of Georgia, Alabama, and Florida combined, more than 900,000 acres of crops were affected by the flooding. Georgia and Alabama suffered the greatest crop losses with more than 400,000 acres in each state impacted. In all three states, peanuts and cotton were the commodities most severely affected. Livestock losses were also significant, especially to poultry, with as many as 250,000 chickens reportedly lost to the flooding. Storm Genesis
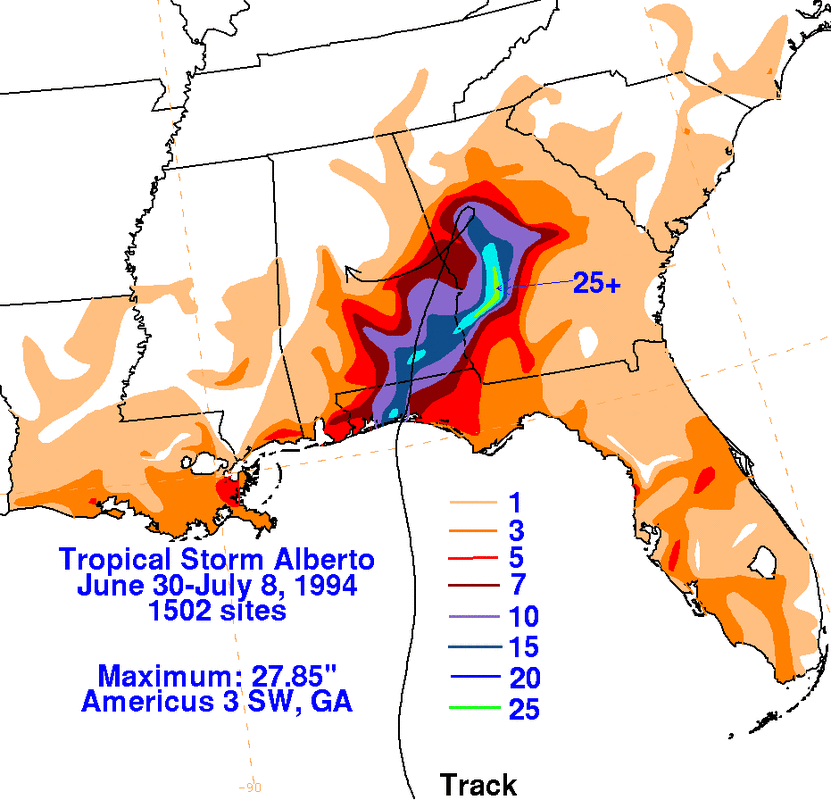
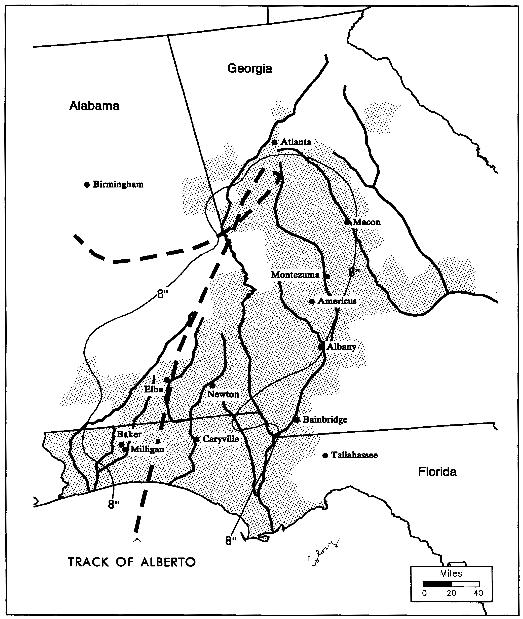
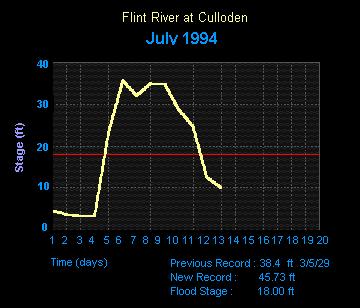
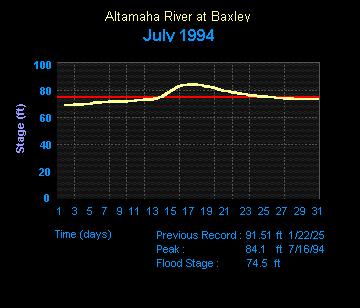
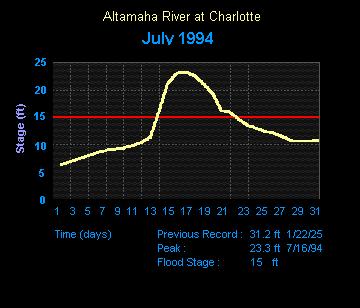
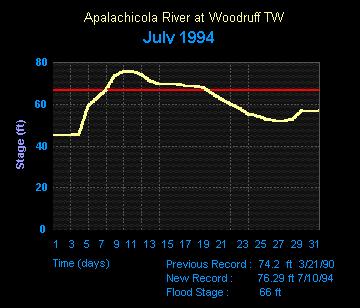
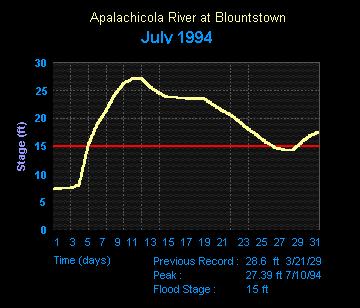
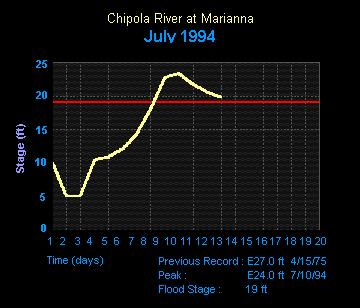
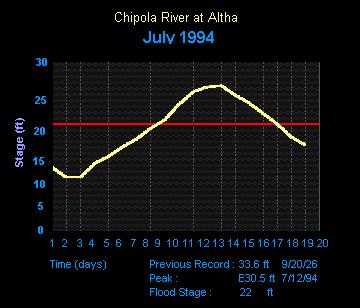
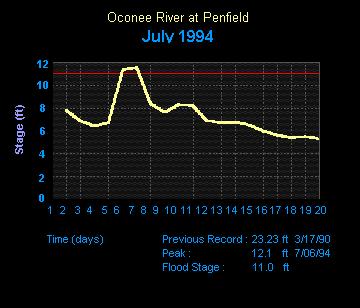
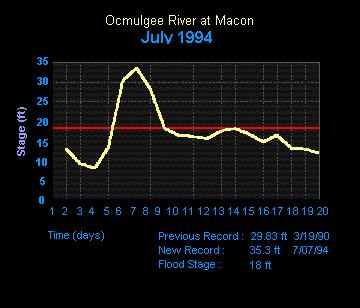
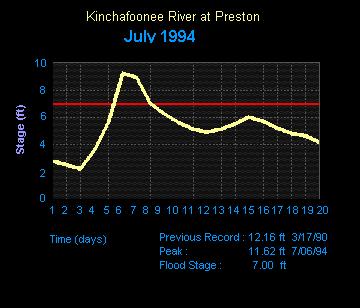
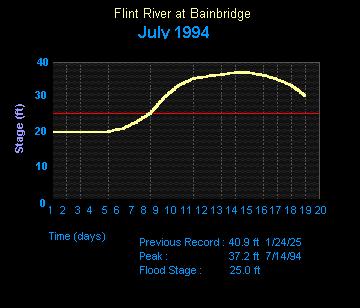
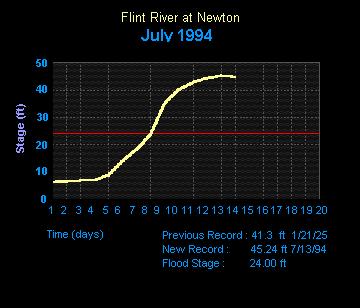
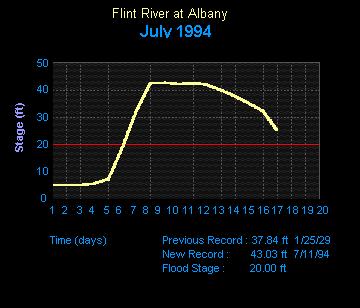
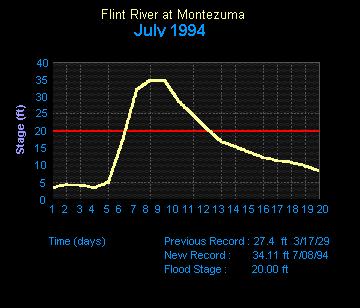
Flooding Summary and Discussion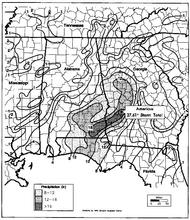 1-4 Click to enlarge 1-4 Click to enlarge here is little question as to the cause of the torrential rainfall associated with Alberto and its remnants. While heavy precipitation accompanies nearly every tropical system, excessive rainfall was produced by the remnants of Alberto due to two main factors: (1) the slow, forward motion of the system and (2) the meandering, looping (retrogressive) nature of the system's track. These characteristics contributed to rainfall accumulations that, in several places, exceeded 20 inches. Noteworthy was Americus, Georgia, which received a storm total of 27.61 inches (July 3-9), including a 24-hour total of 21.1 inches (July 5-6). While such amounts are certainly not unprecedented, they are nonetheless rare, even with decaying tropical systems. Figure 1-4 shows the National Weather Service (NWS) Climate Analysis Center's storm total isohyetal analysis. The heaviest rains (16 inches or greater) fell in a relatively narrow band across southwestern Georgia and southeastern Alabama. Some of the worst flash and urban flooding occurred in this excessive rainfall area, as evidenced by the 15 fatalities that occurred in the vicinity of Americus, Georgia. In contrast, a far larger area was inundated with 8 or more inches of rainfall. It was this heavy precipitation that fell over a fairly large area that generated tremendous runoff and resulted in the widespread river flooding. Figure 1-5 is a composite figure combining portions of Figures 1-1 through 1-4. This figure shows the inland track of Alberto and its remnants, the area enveloped by the 8-inch rainfall isohyet, the major rivers affected by flooding, and the counties that were Presidentially declared disaster areas. As is typical with flood events of this magnitude, widespread major river flooding evolves from flooding which first manifests itself in the form of urban, small stream, and flash flooding. Such was the case with this flood. The first reports of flooding included flooded roads, underpasses, culverts, and the like. Since the heaviest rains were generally close to the path of the center of Alberto, the pattern of flooding essentially followed the path of the storm center. Thus, flooding first broke out across portions of the Florida Panhandle and southeast Alabama, then across southwestern portions of Georgia. Flooding later broke out across much of the remainder of western and central Georgia. As rainfall persisted and soils became saturated, small streams and rivers began to overflow; and small dams were threatened by the tremendous inflow into the reservoirs behind them. Some small, unregulated earthen dams began to fail, and reports of road and bridge washouts became common. Within a day after landfall, the forward motion of Alberto slowed. The rains continued, and some of the larger rivers began to approach flood stage at various locations. Late on July 5, with the center of Alberto coming to a halt near Atlanta, portions of numerous large rivers exceeded flood stage; and river flooding became more widespread and significant. By the morning of July 6, some locations had observed record flooding; and the first crests began to appear along some of the smaller rivers and at some upstream locations along the larger rivers. Alberto's movement became erratic--the system was now moving westward, looping back over a portion of its previous track. Additional rainfall caused a progression in flooding from urban and small stream flooding to river flooding. By July 7, as Alberto's center drifted into central Alabama, rainfall finally diminished, both in intensity and in areal coverage. Tremendous volumes of water were now moving down major river systems in portions of Georgia, Alabama, and Florida: the Flint, Ocmulgee, Chattahoochee, Choctawhatchee, and the Apalachicola Rivers. River flooding peaked, both in terms of coverage and severity, during the period July 6-15; but flooding would continue along portions of some rivers until close to the end of July. By far, the worst flooding occurred along Georgia's Flint and Ocmulgee Rivers and their tributaries. Some of the hardest hit cities along these rivers include Albany, Macon, and Montezuma. Across the entire three-state area impacted by the flooding, 17 NWS river forecast locations set new record flood stages, some breaking the old record by 5-7 feet. In all, 47 NWS river forecast locations exceeded flood stage. Crests of 5-15 feet above flood stage were common, while portions of some rivers observed crests that exceeded flood stage by more than 20 feet. The NWS offices involved in the flood event across the three-state area issued 657 watches, warnings, and statements related to the event; and the Southeast River Forecast Center (SERFC) issued 238 NWS internal river forecasts. River Flooding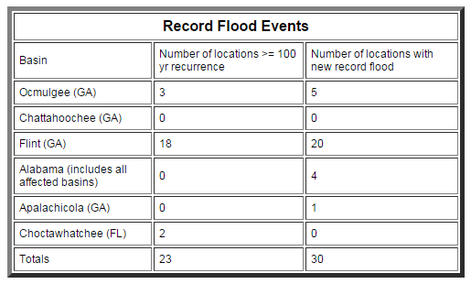 Table 2-2 Table 2-2 The area affected by flooding from the rains of Alberto stretched from central Georgia southwest into southeastern Alabama and southward into the Florida Panhandle. The river basins with the most severe flooding included the Ocmulgee and Flint Basins in Georgia, the Chattahoochee Basin along the Georgia-Alabama border, the Choctawhatchee Basin in Alabama, and the Apalachicola Basin in Florida. Appendix B includes the USGS listing of the crest values, previous record crests, and return interval of the crests for this event. Appendix C also includes selected hydrographs. Table 2-2 summarizes the number of locations by basin that equaled or exceeded the 100-year recurrence interval and the number of locations that exceeded the previous record crest. The SERFC issued 238 river forecasts for locations in the impacted area during this event. On July 3, 24-hour operations began and continued through July 9 at 9 p.m. with the brief exception from midnight July 4 to 6 a.m. on July 5. The SERFC Hydro-meteorological Analysis and Support (HAS) unit had not yet become operational and contained only one of the three positions. As was Southern Region policy at the time, the SERFC did not use QPF in the preparation of river forecasts since the majority of the WSFOs in their forecast area did not routinely supply QPFs. Interestingly, an analysis of the forecasts indicates the lack of any clear trend in the river forecasts issued. Some forecasts were very close to the observed crests several days in advance; some forecasts were lower than the observed crest; and a few forecasts were above the observed crests. The destruction and human misery wrought by the floodwaters were enormous. A brief summary of some of the major flood impacts is listed below. Ocmulgee River - Macon, Georgia, was swamped by a record crest of 35.4 feet on July 7 (previous record was 28.00 feet on 11/29/48). The floodwaters over-topped and breached levees at Macon and flooded the water treatment plant. Freshwater was not restored for nearly 3 weeks. Two major Interstate Highways (I-75 and I-16) were closed for approximately 36 hours due to the floodwaters and required traffic detours of more than 100 miles. Several hundred homes were evacuated in Macon, most of which eventually flooded. Flint River - Some of the most spectacular flooding occurred along the Flint River. The crest, generally 20-25 feet above flood stage and 4-6 feet above the previous record crest (January 1925), wreaked havoc as it moved downstream and caused immense damage as well as the evacuation of tens of thousands of people. Blackshear Dam, upstream of Albany, was overwhelmed; and the high pool level forced the evacuation of residents in about 1,400 homes around the lake (almost all of which were ultimately inundated) before the dam was over-topped and breached. Albany suffered major flood damage after nearly one-third of its 76,000 residents were evacuated. Further downstream, at Newton, nearly the entire town was flooded to depths of 15-20 feet. After exceeding previous record flood levels as far downstream as Newton, the Flint River at Bainbridge crested about 4 feet below record levels (although the measured discharge of 108,000 cfs exceeded the previous record discharge of 101,000 cfs). Section 2.3.3 of this report further analyzes the Bainbridge forecast problem. Chattahoochee River - This river is somewhat more controlled by impoundment structures than the other rivers impacted by Alberto, but the volume of water still caused considerable flooding along the lower half the river. At Columbia Tailwater, a record crest more than 2 feet higher than the previous record, and over 12 feet above flood stage, was observed. Apalachicola River - The Flint and Chattahoochee Rivers join at Lake Seminole, which is formed by Woodruff Dam. Outflow from Woodruff Dam flows down the Apalachicola River. The excessive inflow into Lake Seminole forced high discharges from Woodruff Dam (the peak discharge was 224,486 cfs on July 10th) and caused record flooding at Blountstown. Choctawhatchee River - Major flooding occurred along this river in Alabama and Florida as a crest 15-20 feet above flood stage moved down the basin. This crest was about 4 feet below the record crests. Considerable damage resulted at Newton and Geneva, Alabama, and Caryville, Florida. Additional major damage occurred in Dale County, Alabama, and Holmes County, Florida.
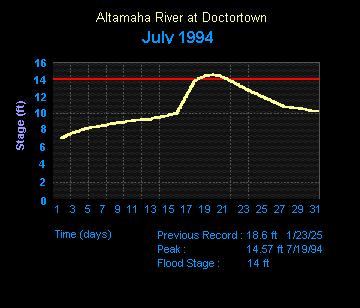
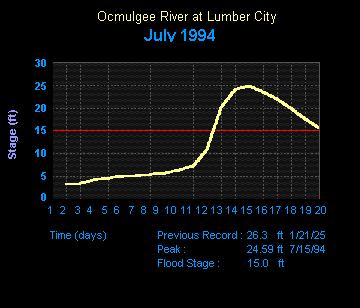
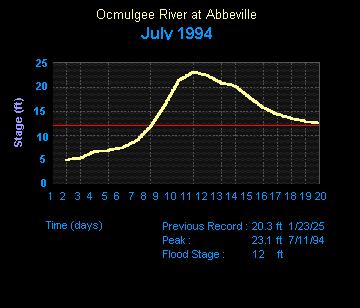
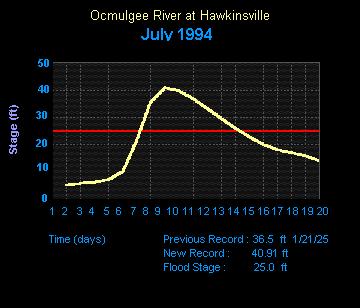
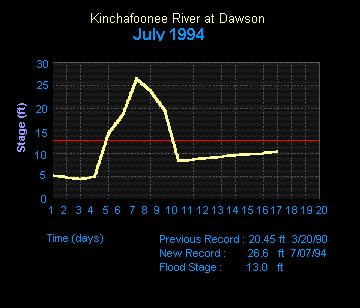
Appendix A - Video Summary of the Damage from AlbertoThese are great documentaries about the flooding in middle and south Georgia. One is more than 50 minutes long and the other one 3 hours, but some amazing shots. Appendix B - U.S. Geological Survey Peak FlowsAppendix C - Hydrographs
0 Comments
I am going to use this page to record significant weather events in Georgia. I can only go so far back as the past events are difficult to get information about. I will be pulling data from every source I can find and making my best effort to give proper credit in the process. Much of the information will come from the National Weather Service and the majority of the credit goes to them. I will try to figure out a way to keep the list of events in chronological order but it may have to be on another page... we'll see. I will try to tag and categorize the events to make them easier to find. Each event will probably be work in progress, as I'm sure I'll find more information as time goes on. Over the weekend, I'll be starting with some of the major flooding events here in Georgia, and move on to winter weather. This list could go on and on, so let's see where it takes us! |
|
||||||||||
OLD NORTH GA WX BLOG

 RSS Feed
