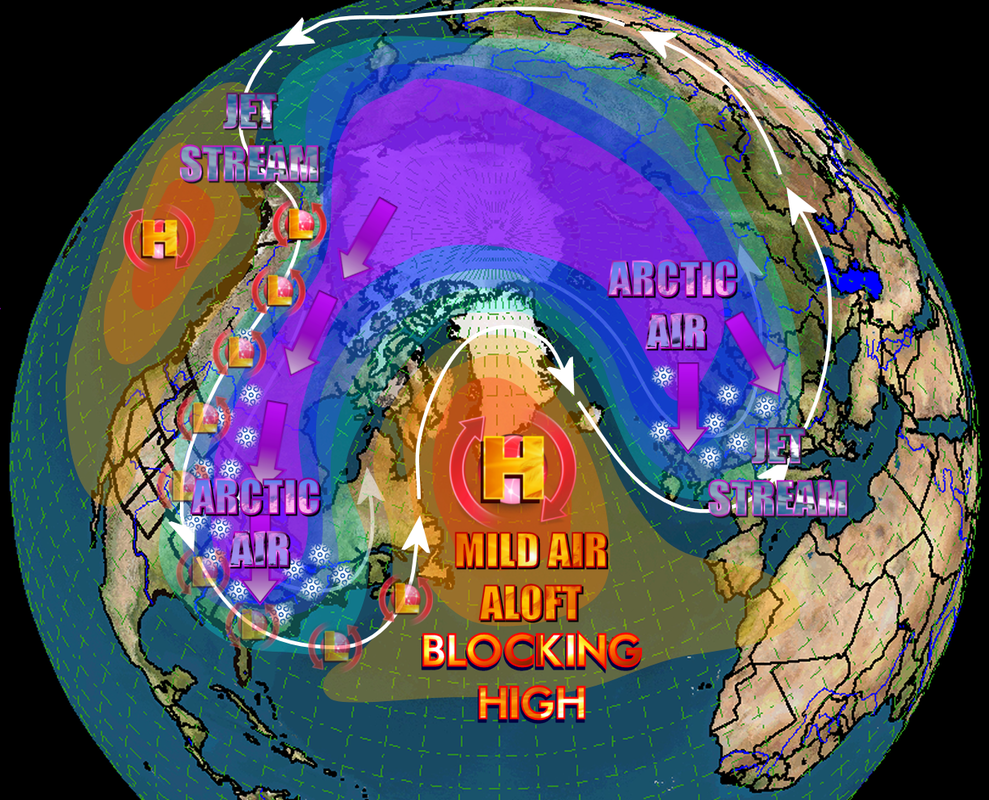
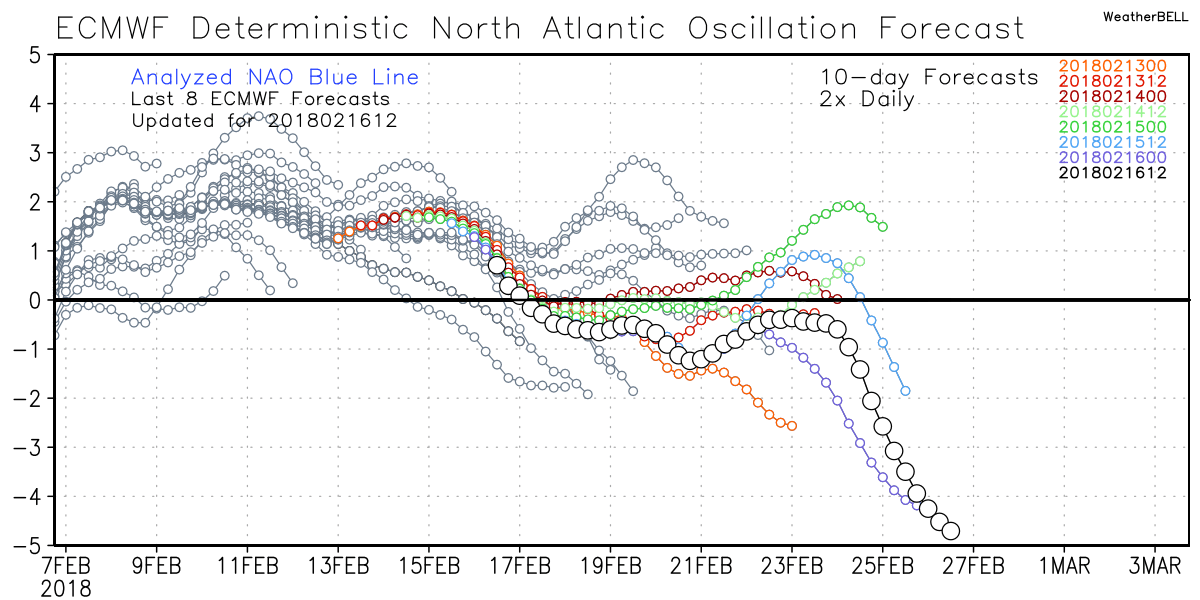
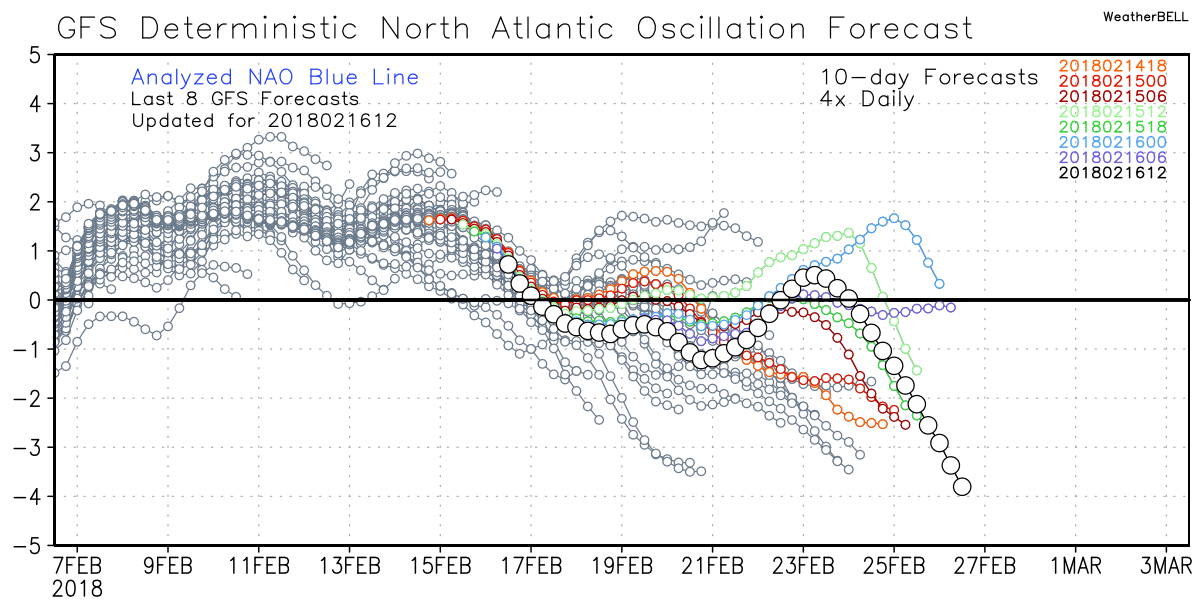
 Example of a Negative NAO - click to enlarge Example of a Negative NAO - click to enlarge All models are in very good agreement about the state of some very important teleconnections as we head toward the end of the month, and I wanted to show you some examples of what I'm talking about. The talk right now is how the NAO or North Atlantic Oscillation, is about to take a negative plunge. "The North Atlantic Oscillation (NAO) is a weather phenomenon in the North Atlantic Ocean of fluctuations in the difference of atmospheric pressure at sea level (SLP) between the Icelandic low and the Azores high." The negative phase of the NAO reflects above-normal heights and pressure across the high latitudes of the North Atlantic and below-normal heights and pressure over the central North Atlantic, the eastern United States and western Europe. The image above shows a NAO block. I'll first show you what the models are depicting and then I'll show you the analog results of that for February and March. You can thank the Sudden Stratospheric Warming event for he steep decline in the Arctic Oscillation (AO) and NAO values. We need a little more cooperation from the EPO or East Pacific Oscillation to add the icing on the cake. Or who knows... maybe white stuff on the ground? :-) The first two images are the Euro and GFS operational models from the 16th. The Euro is diving off the charts negative with the GFS not far behind.
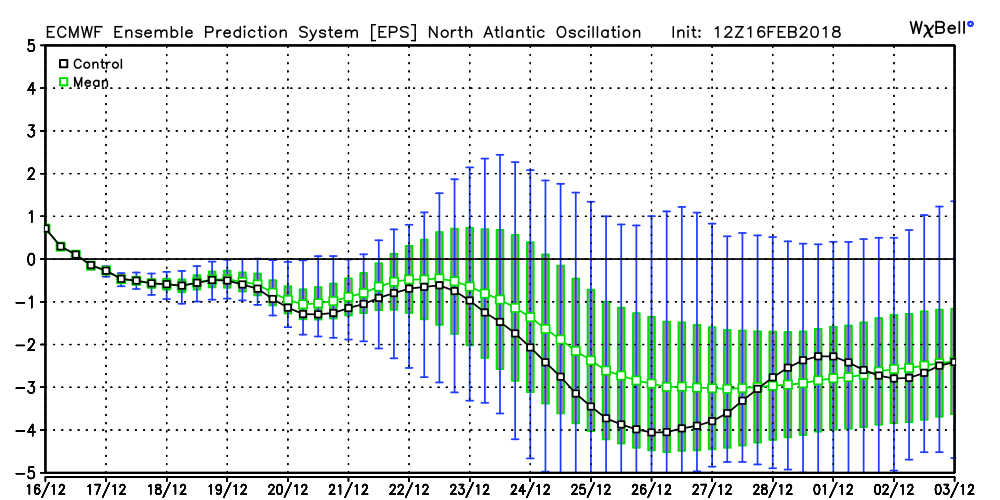
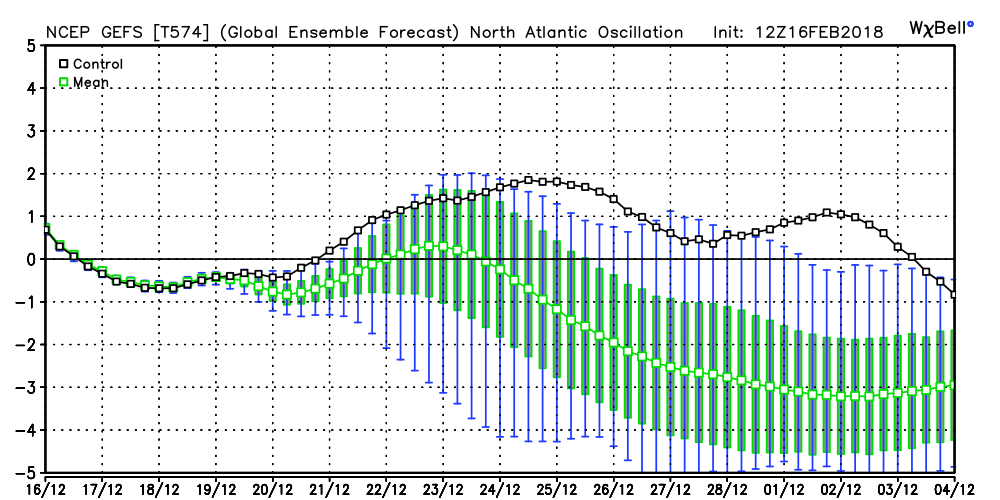
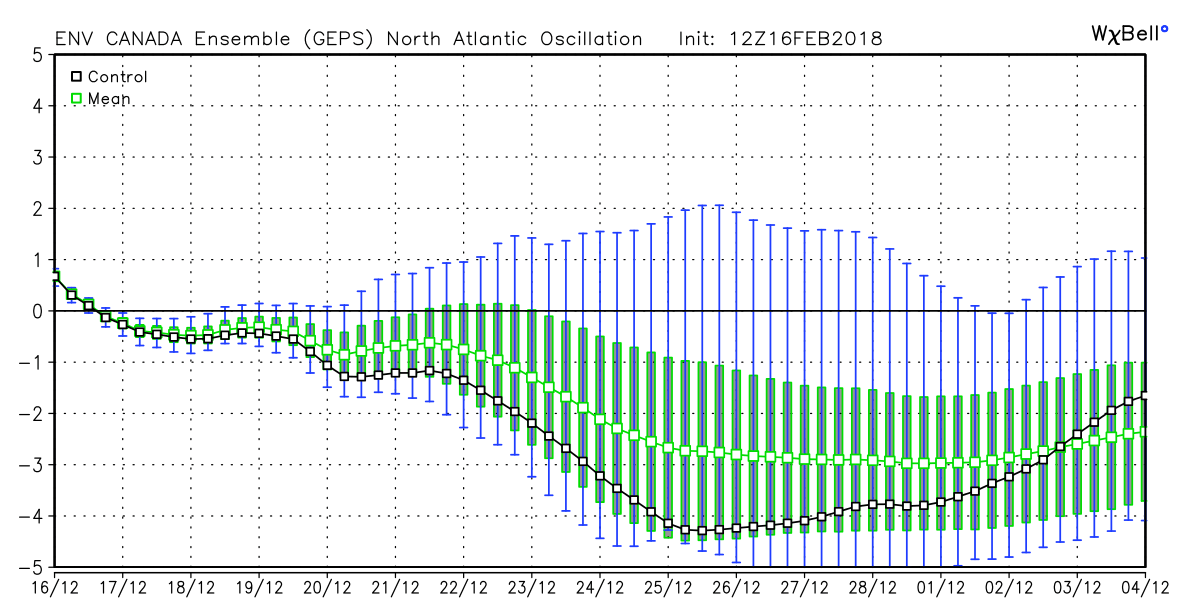
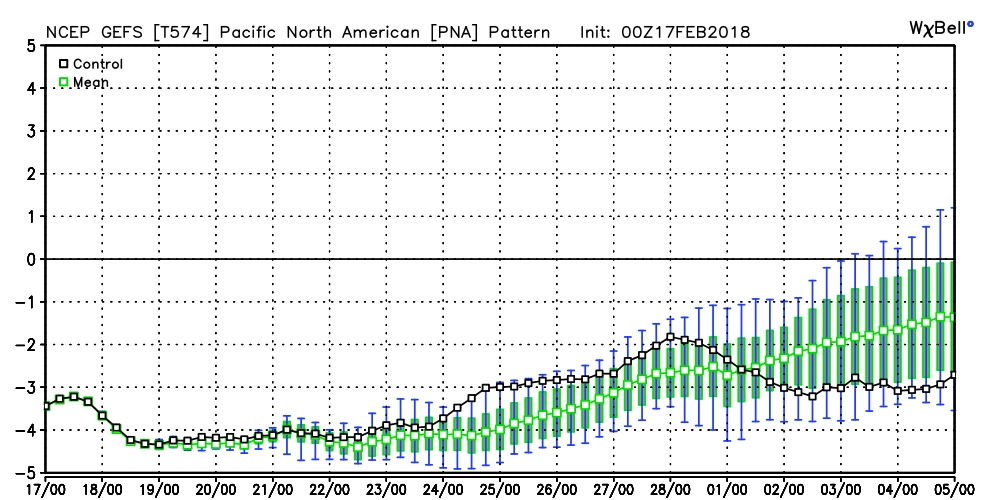
The images below are the ensemble runs of the three major models for the NAO. The darker line in each image is the control run, the center green line is the ensemble mean. The taller green bars show the spread of the ensemble members. As you can see, the ensemble members for all models agree on a very negative NAO in our near future.
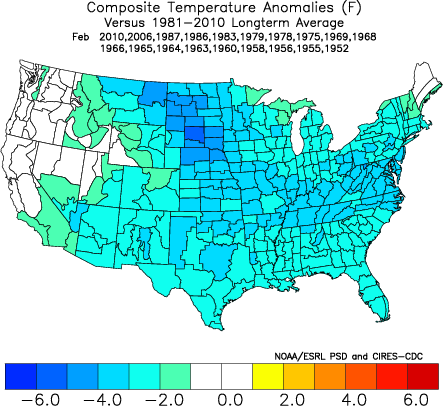
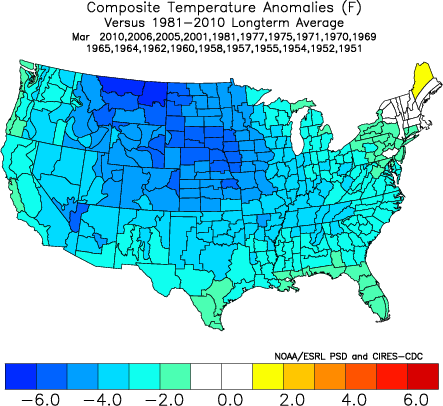
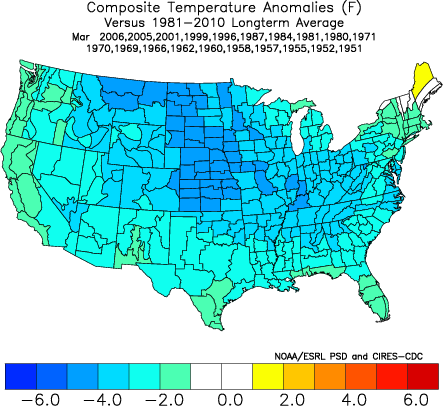
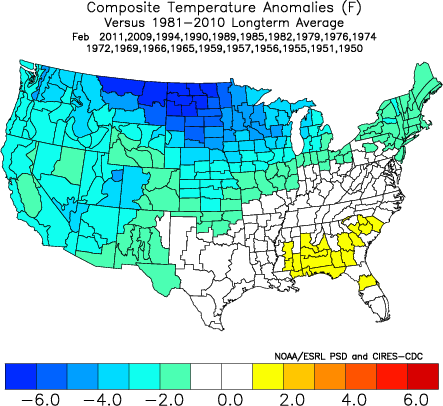
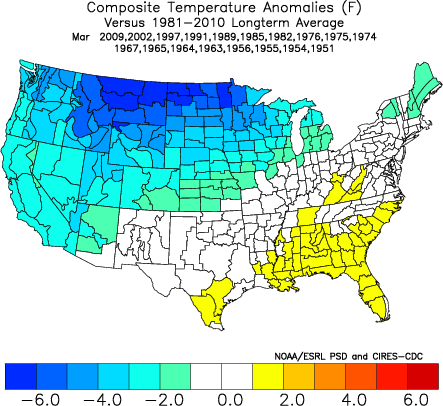
The images below show the "normal" temperature outcomes with a negative NAO in February (left) and March (right)
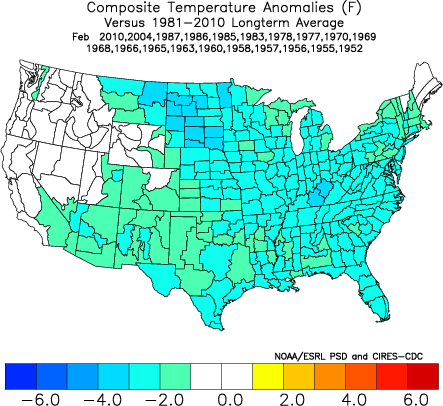
 Example of a Negative Arctic Oscillation - click to enlarge Example of a Negative Arctic Oscillation - click to enlarge As long as we're talking about the Arctic Oscillation, here's a broad brush look at an example of a negative AO. In the negative phase, the polar low pressure system (also known as the polar vortex) over the Arctic is weaker, which results in weaker upper level winds (the westerlies). The result of the weaker westerlies is that cold, Arctic air is able to push farther south into the U.S., while the storm track also remains farther south. The opposite is true when the AO is positive: the polar circulation is stronger which forces cold air and storms to remain farther north. The Arctic Oscillation often shares phase with the North Atlantic Oscillation (NAO), and its phases directly correlate with the phases of the NAO concerning implications on weather across the U.S. The two images below show the outcome of a negative AO for February (left) and March (right).
There are other teleconnections that aren't quite as favorable, and the PNA is one of those. Right now it's fairly deep in the negative range, and you can see from the two images to the right, that makes things a little warmer here at this time of year.
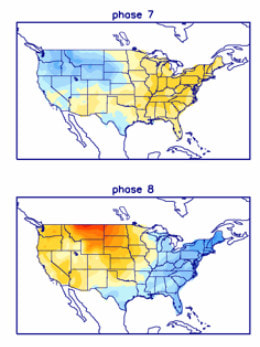
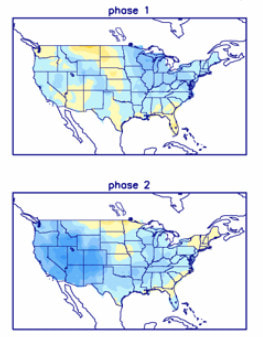
 MJO all model mean MJO all model mean We've been stuck in Phase 7 of the MJO which is a warm phase for us at this time of the year, but it looks like it will start moving into Phase 8, 1, 2, even if only weakly. Phases 6 and 7 which we just went though are warm phases during the winter months, and the strength of the amplitude made things even worse. The 8, 1, 2 phases are cooler than the one we are currently in The combination of favorable high latitude blocking and the MJO should allow for the return of cold air for the month of March. The main concern will be how much Pacific air we get and how much the Bermuda ridge wants to flex its muscle.
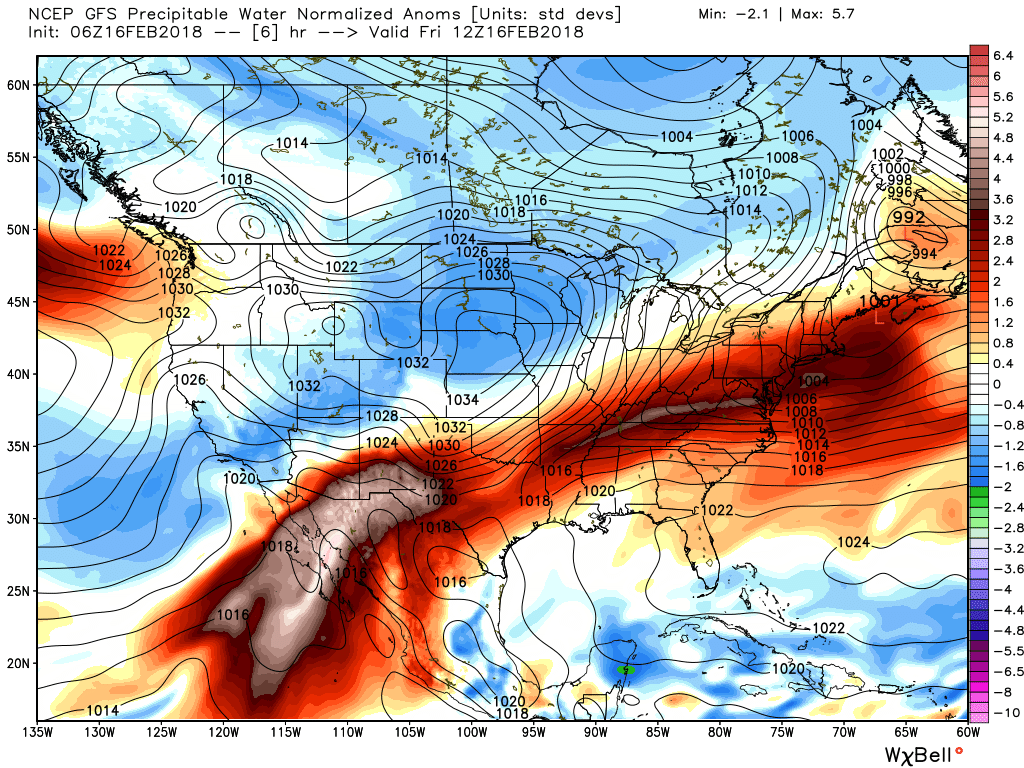
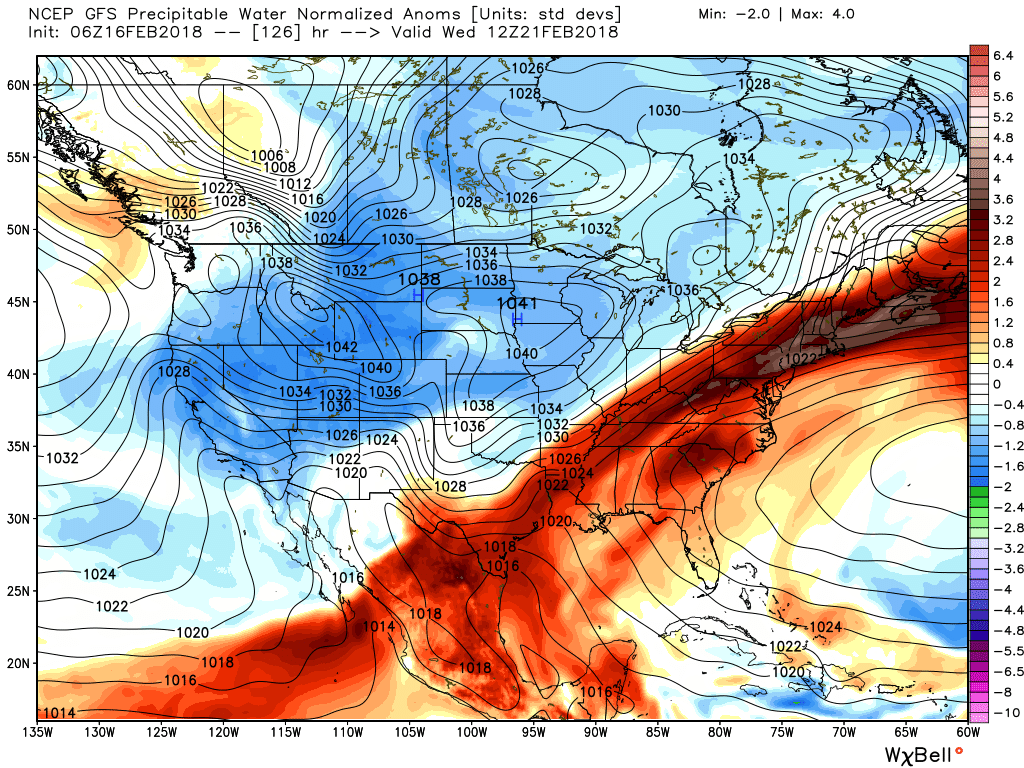
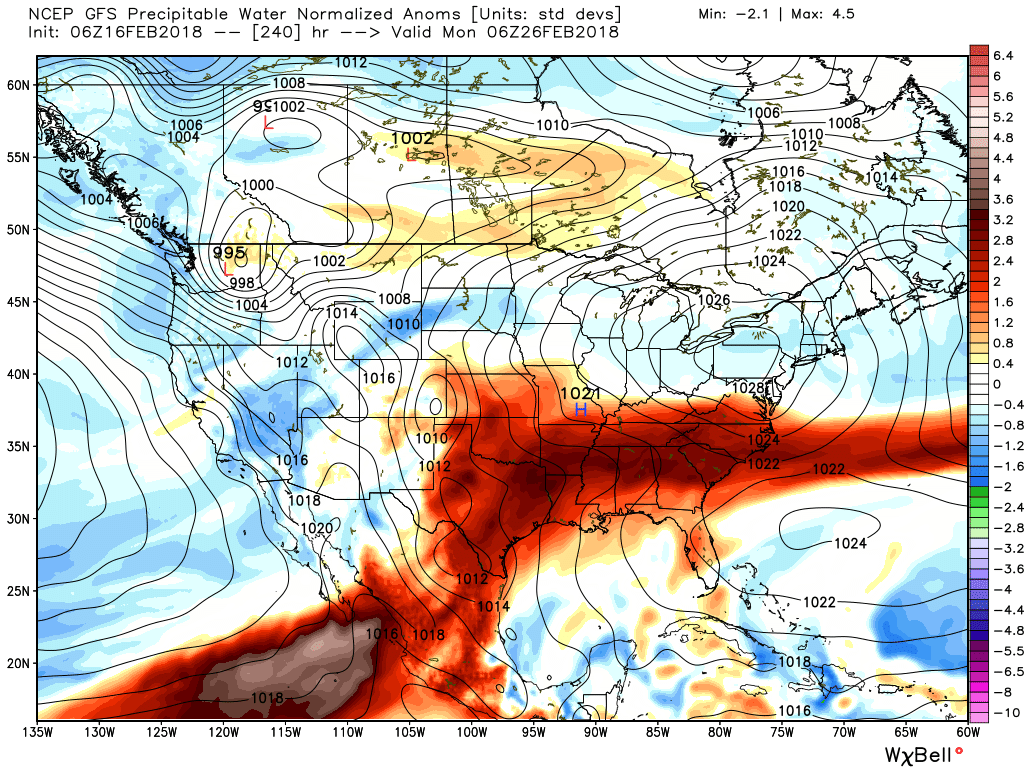
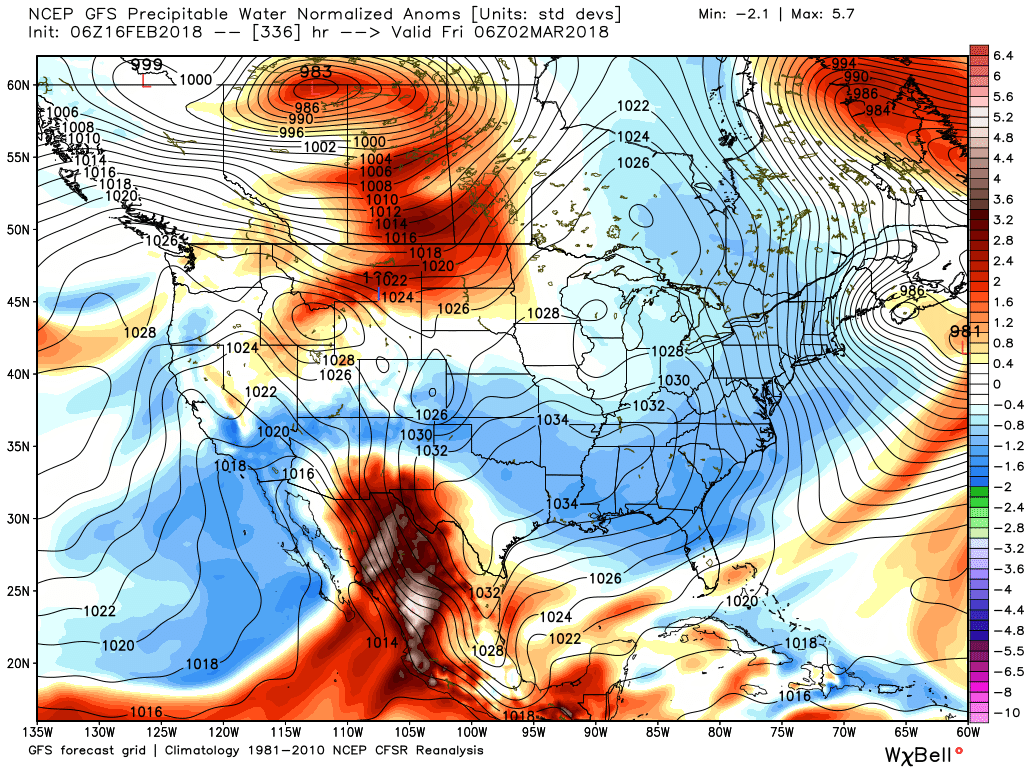
 No shortage of warm moist air as we are stuck in what would normally be a La Nina pattern across the southeast. These three images show the precipitable water values for today, Wednesday, and next Monday, and you can see how the values are running several standard deviations above normal for this time of year. And we still need the moisture, so I'll take it while we can get it.
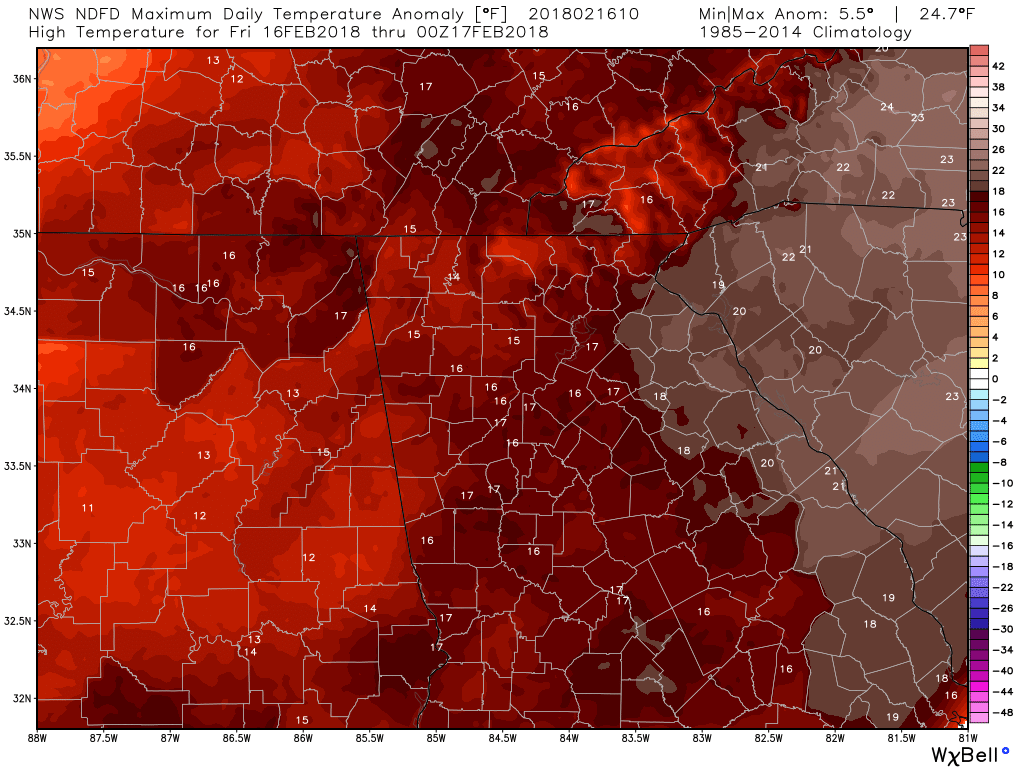
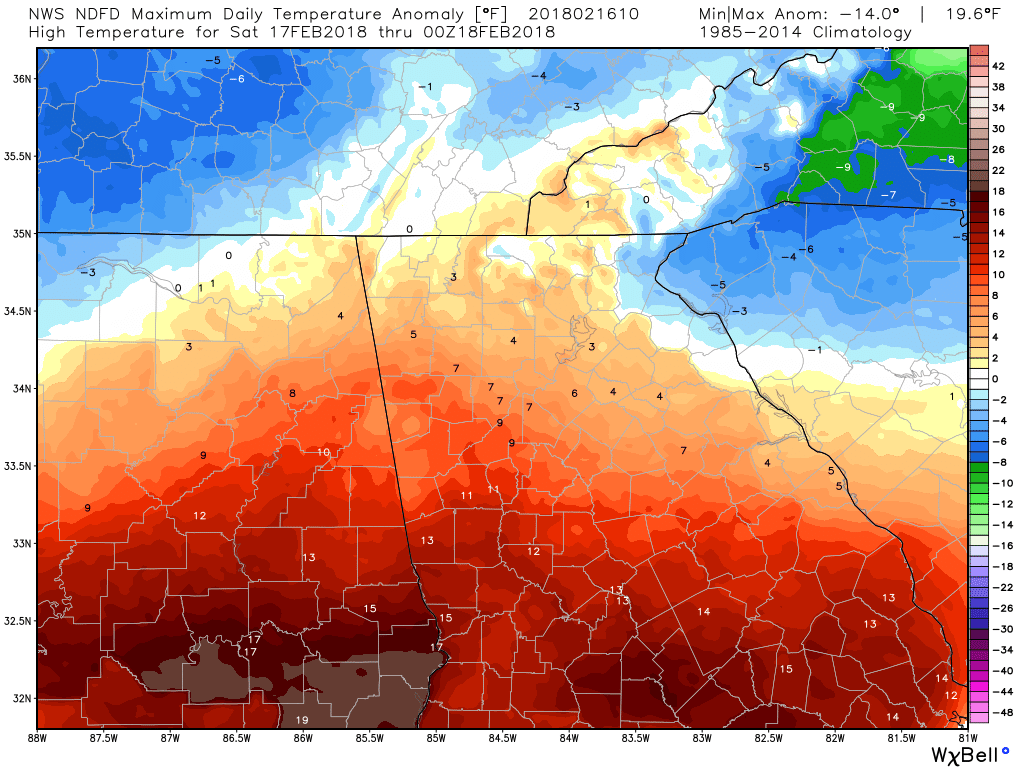
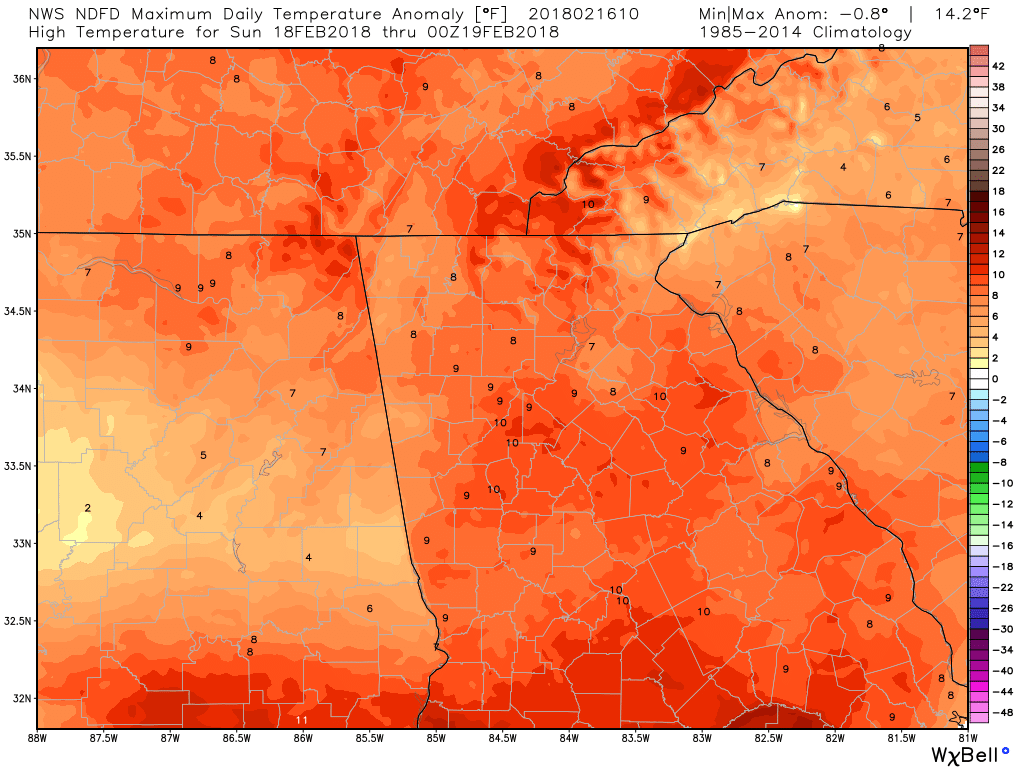
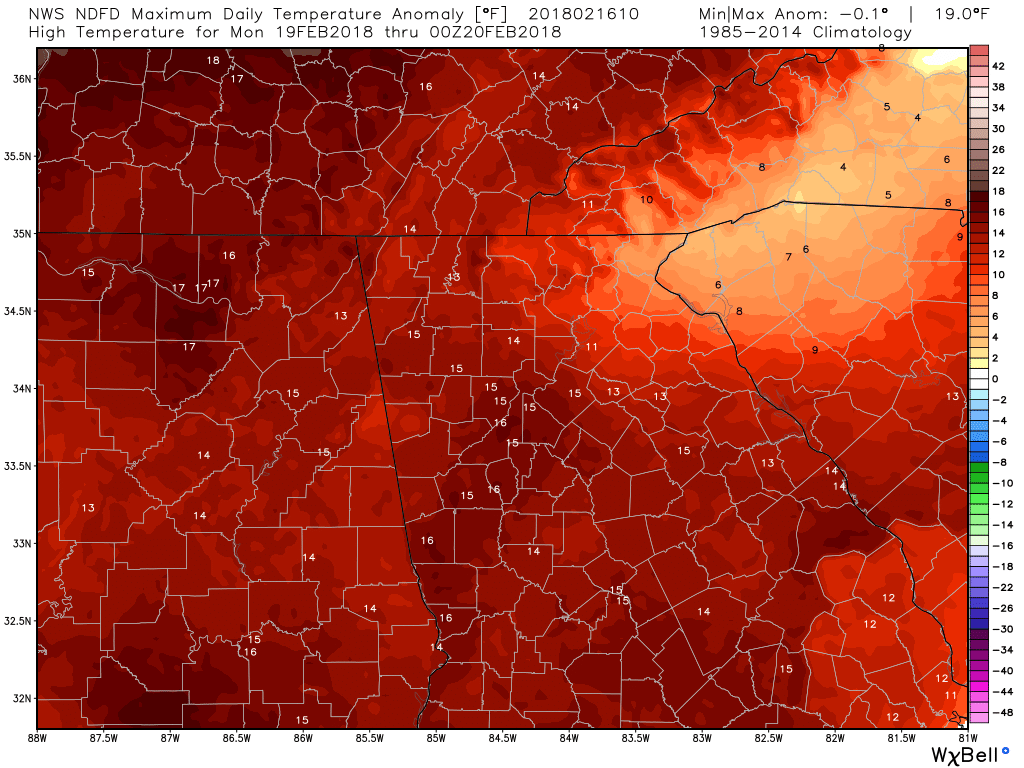
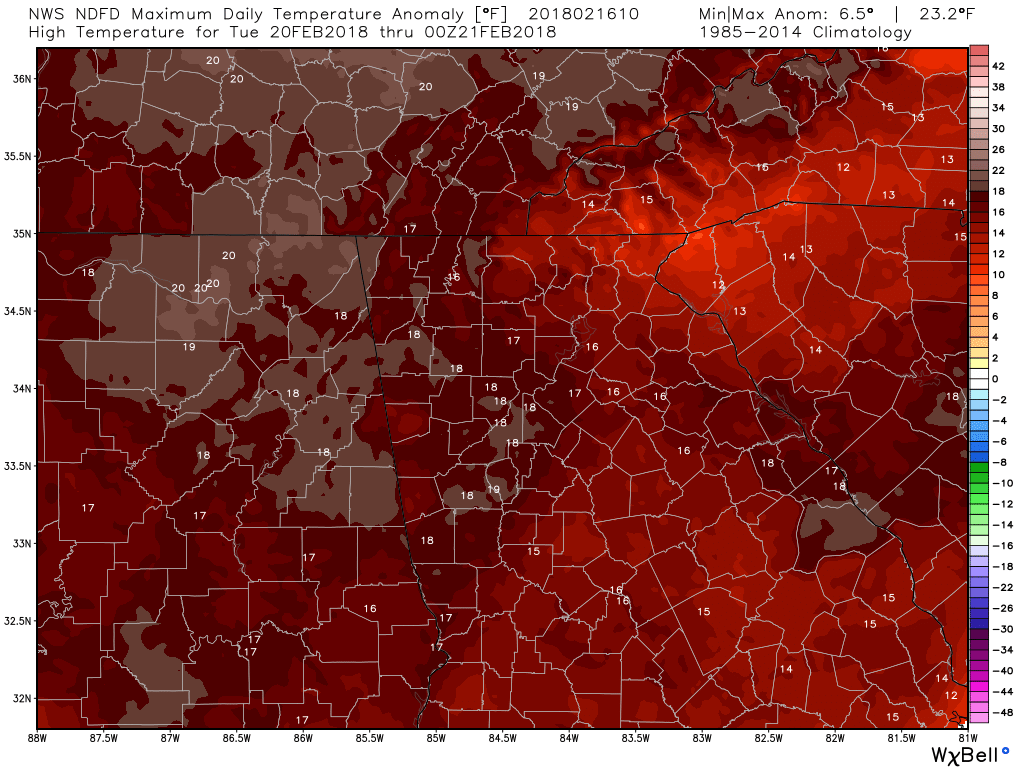
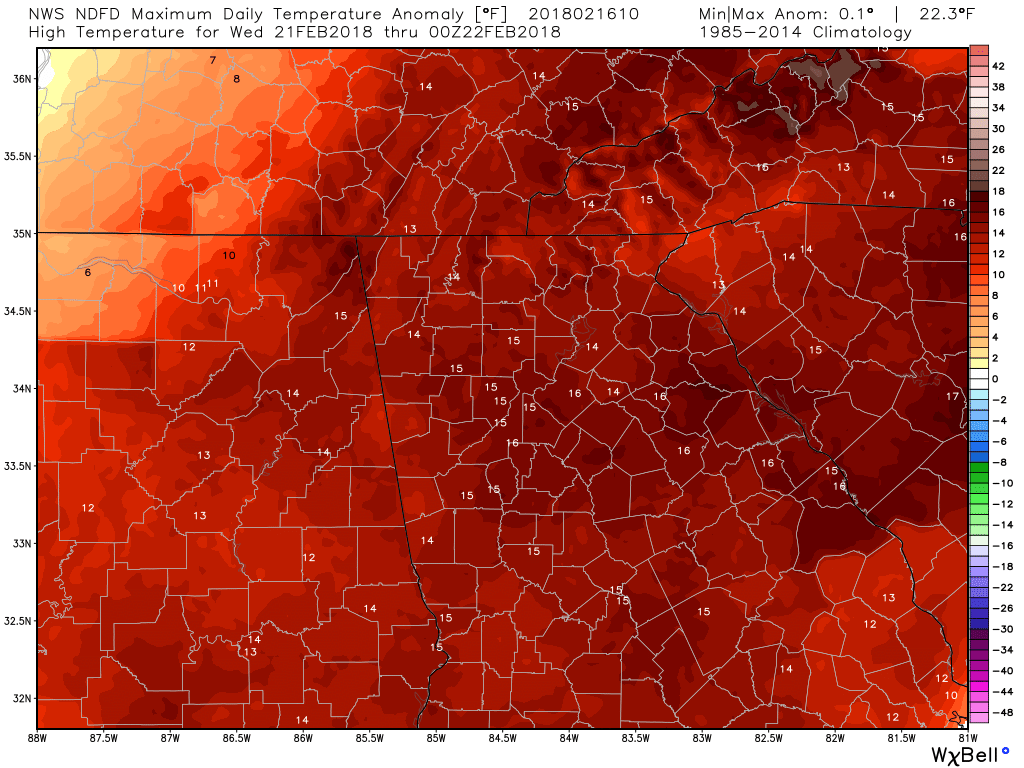
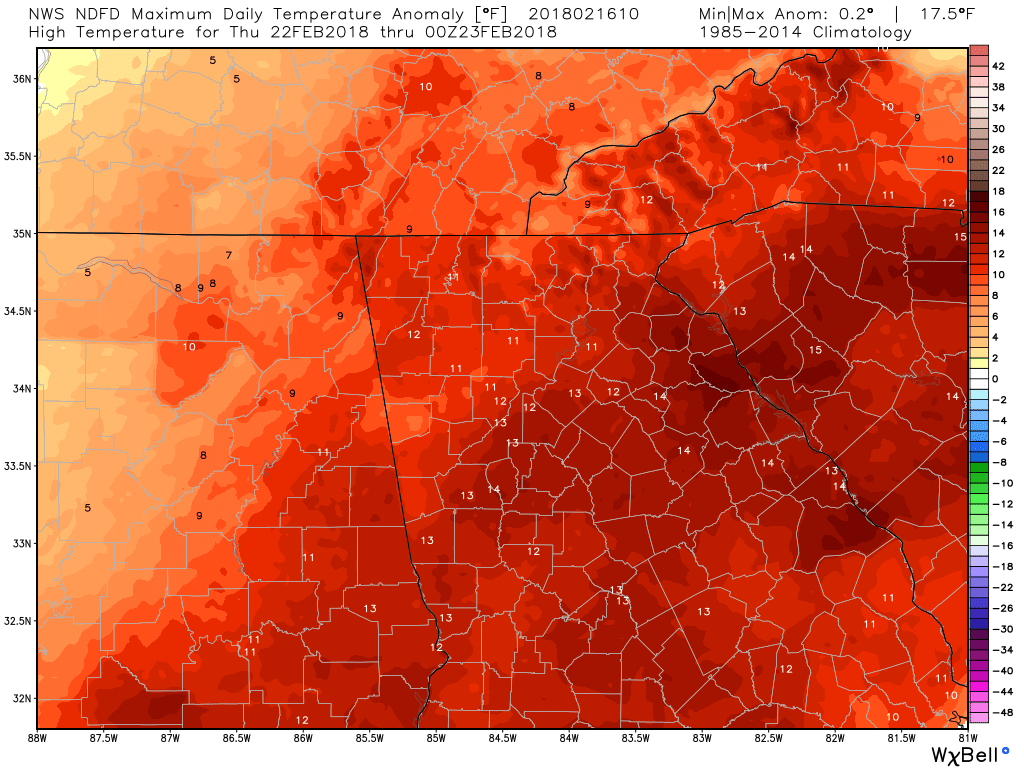
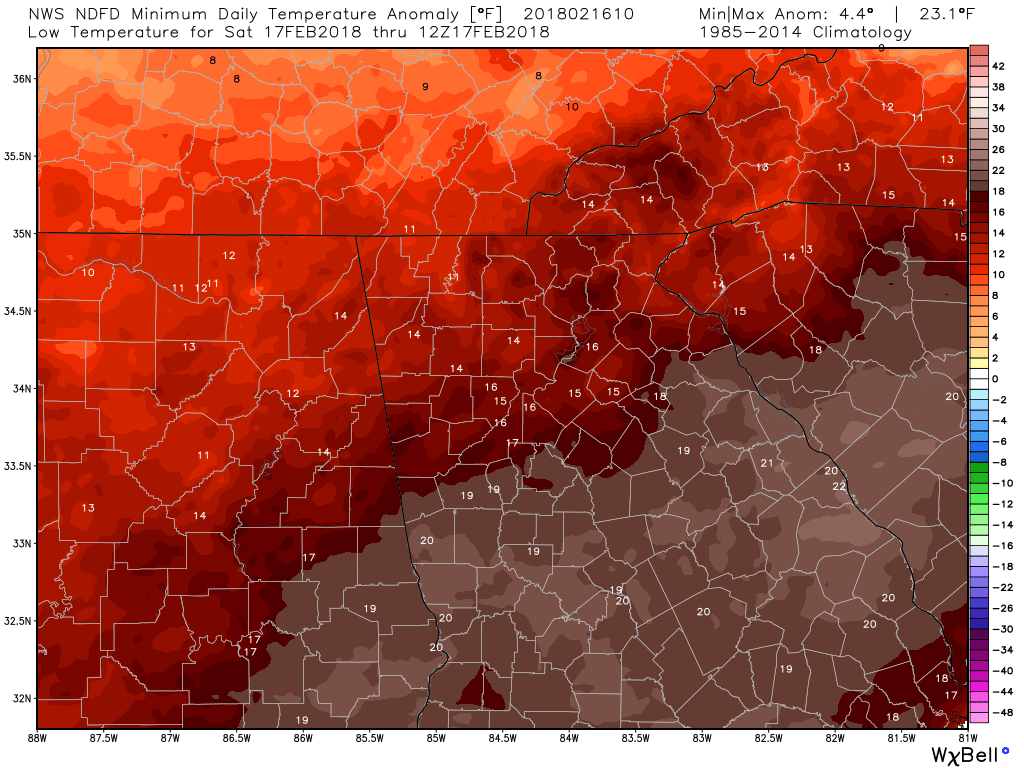
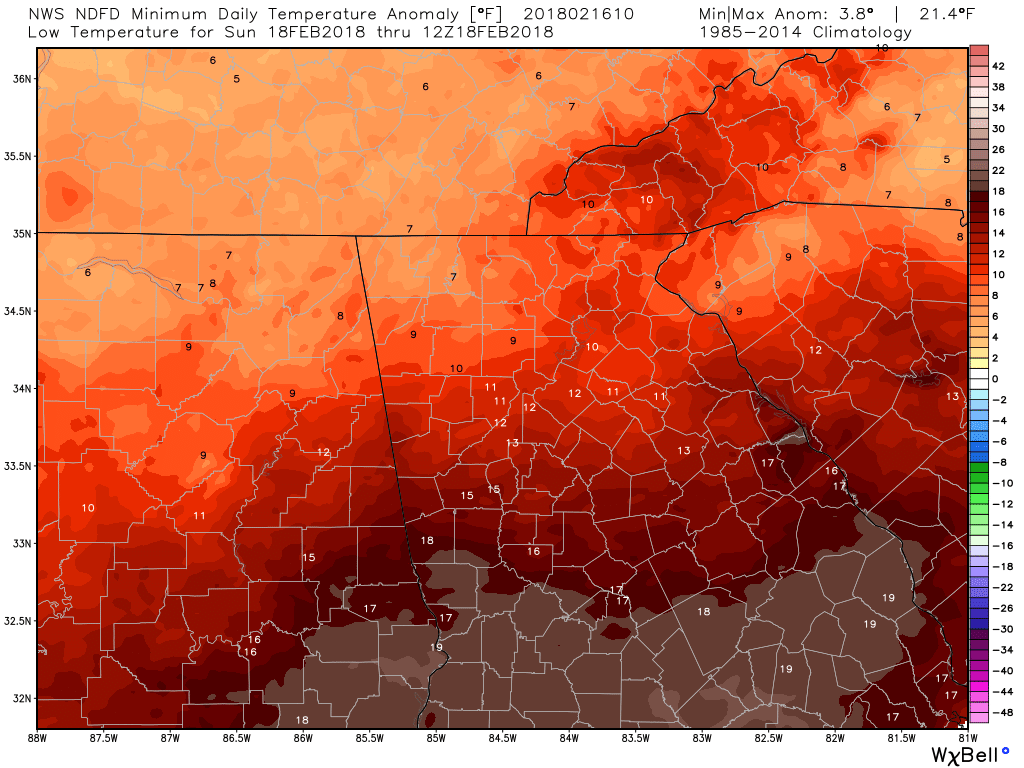
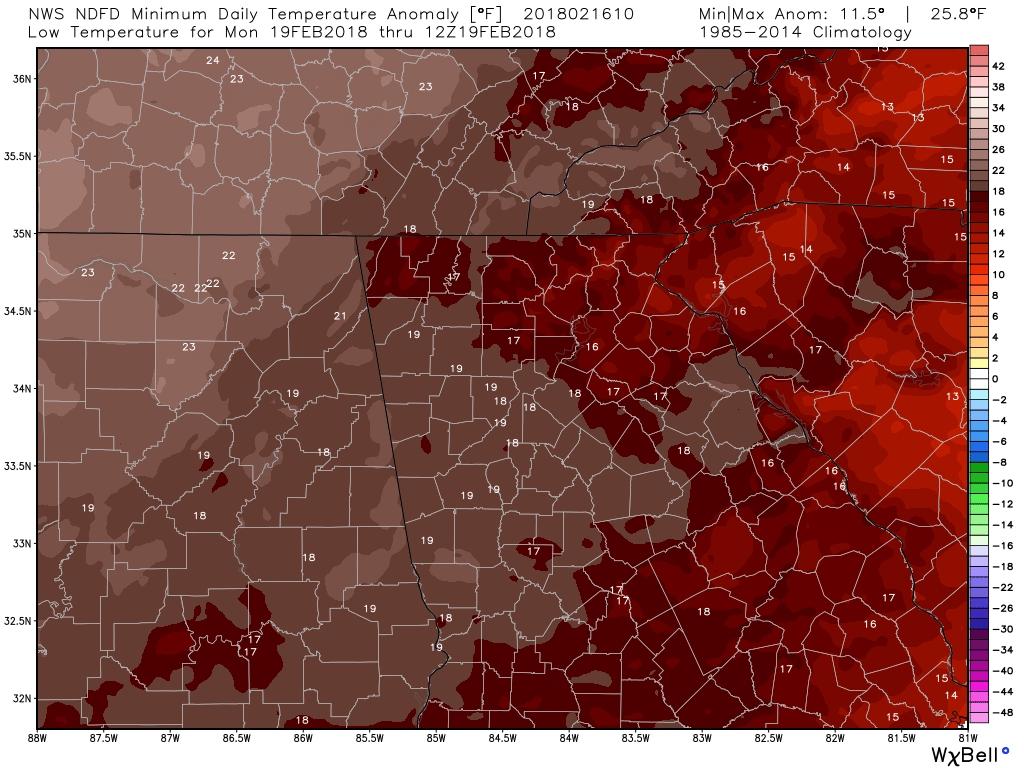
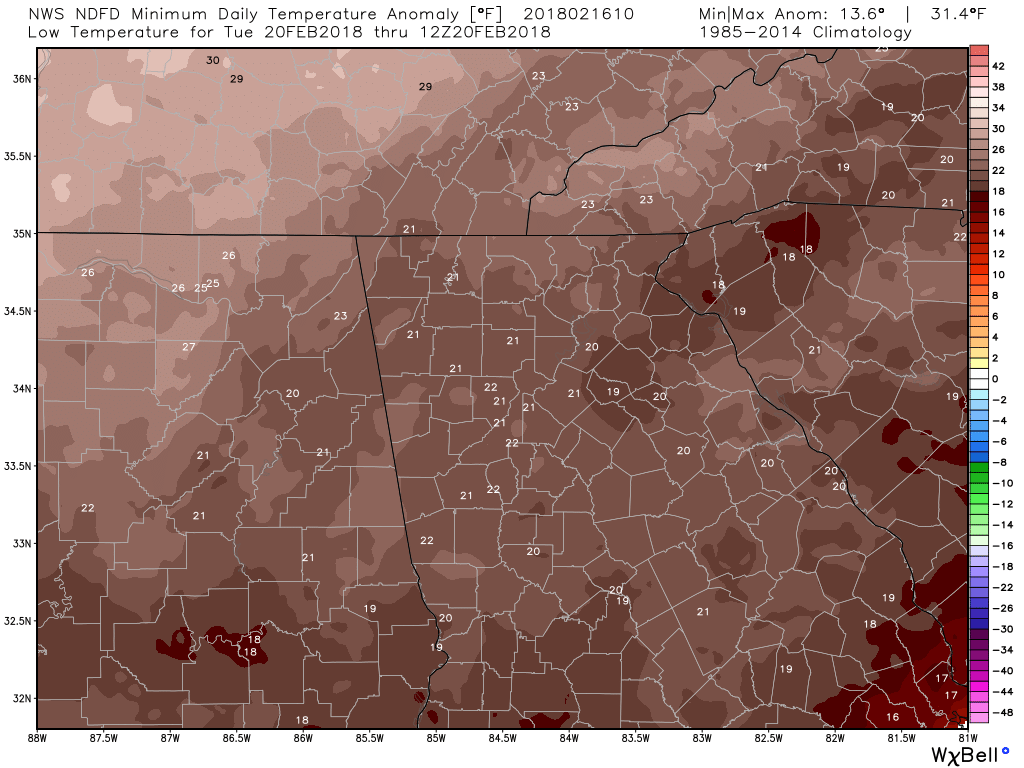
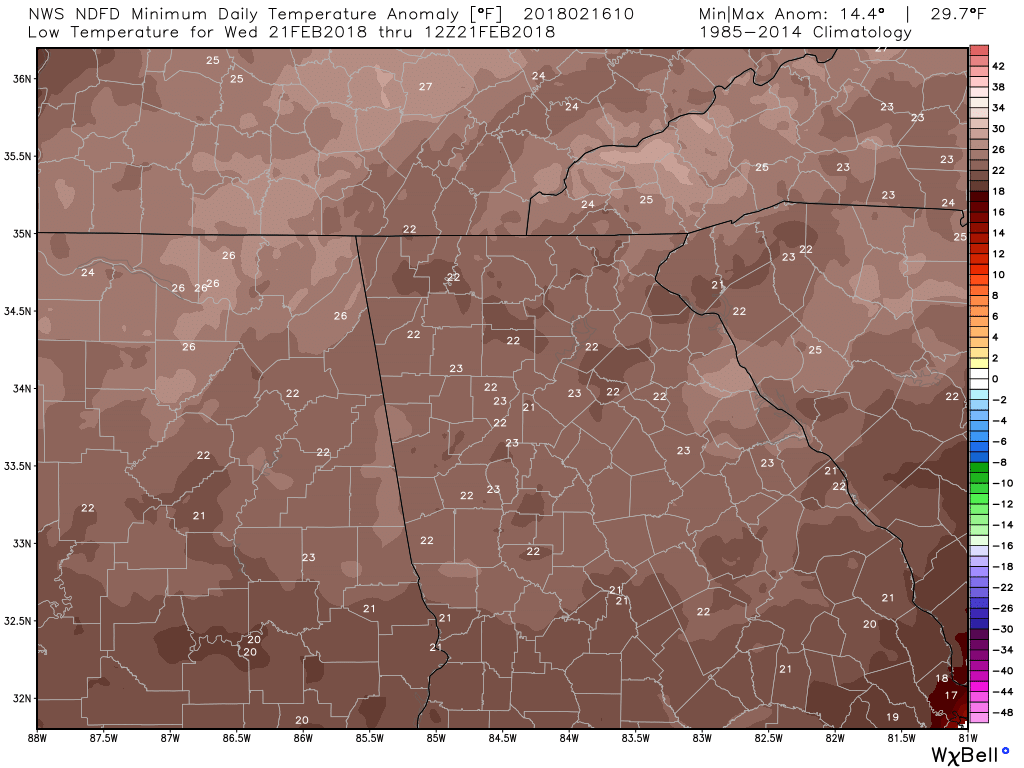
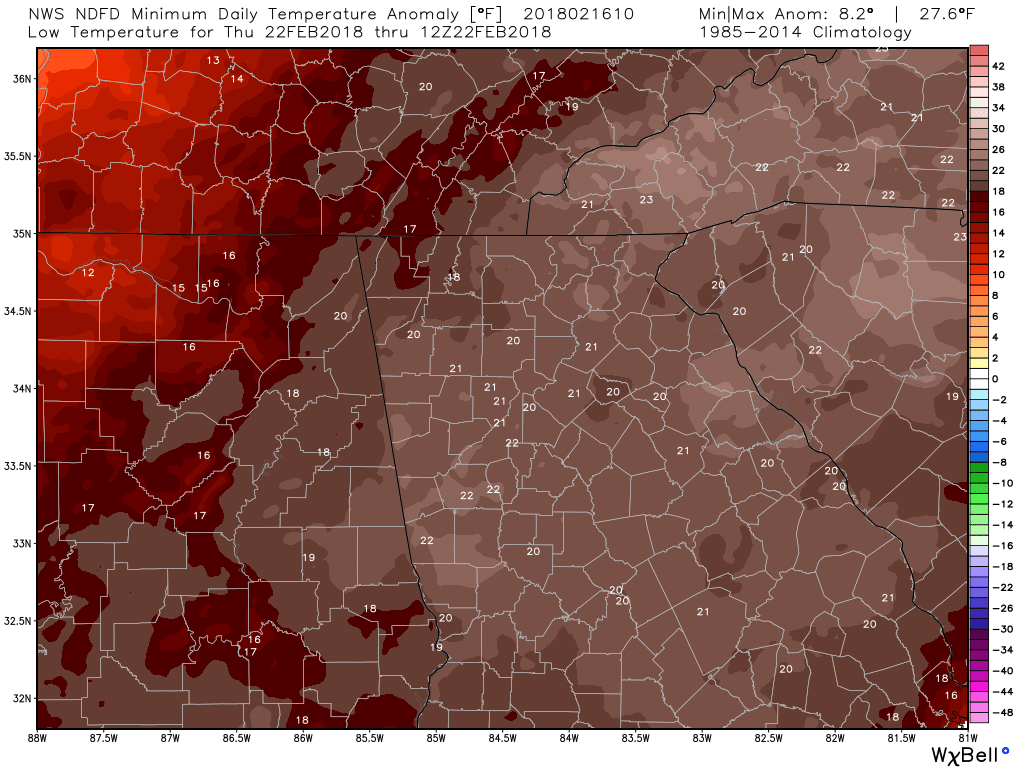
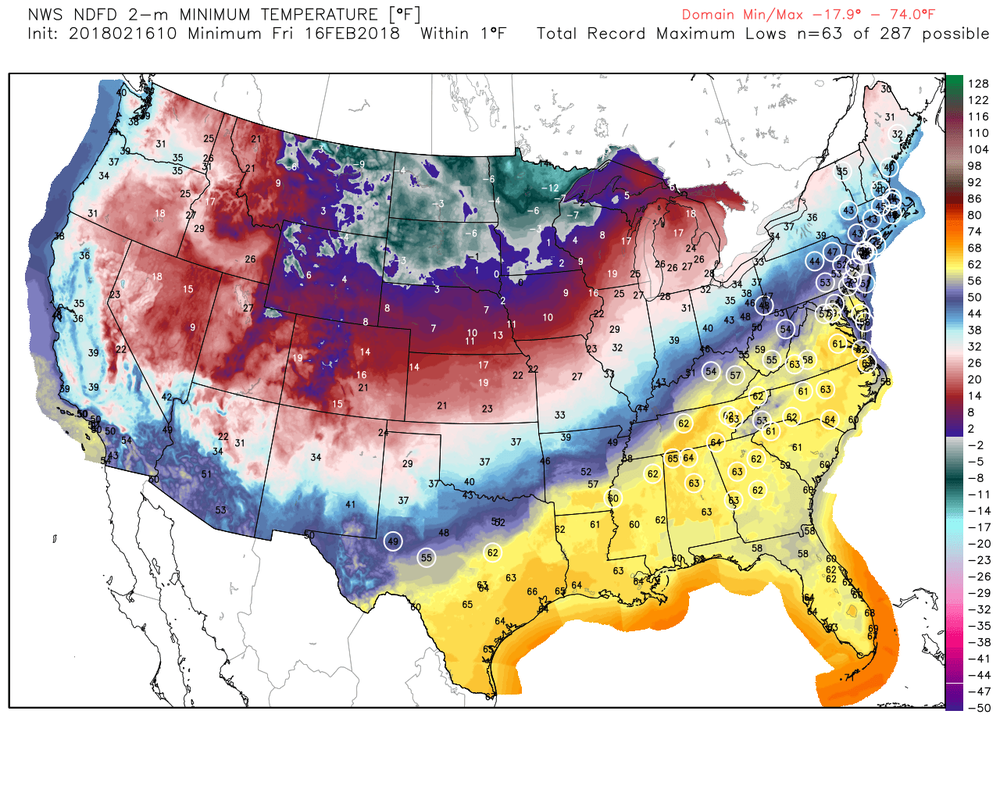
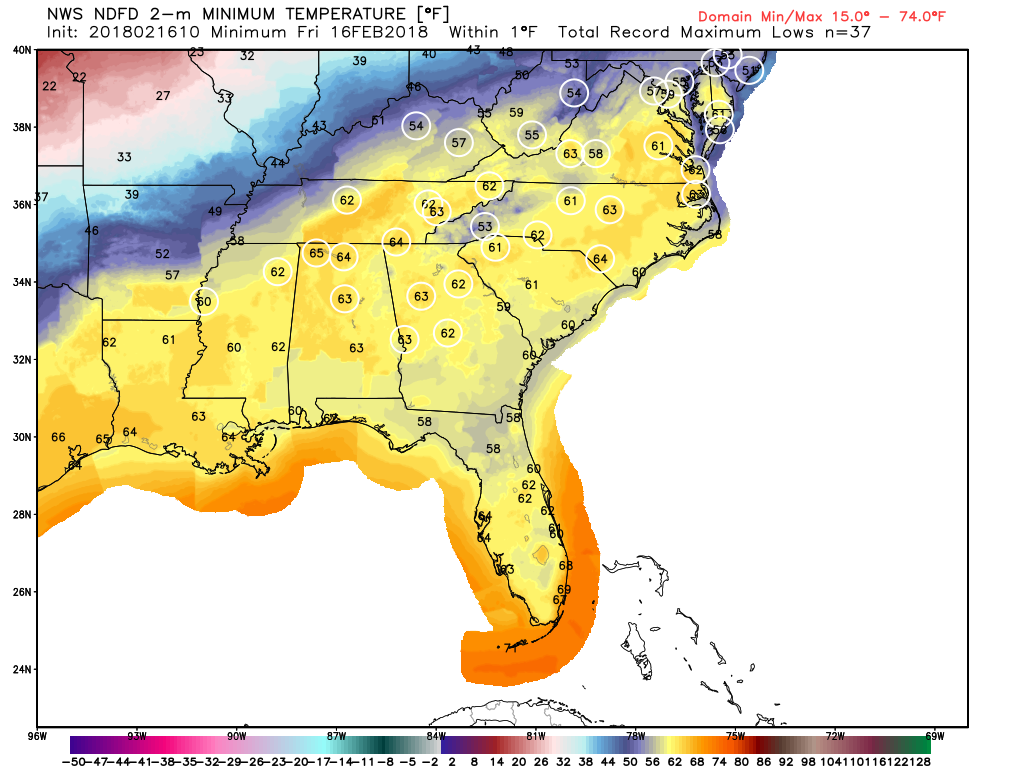
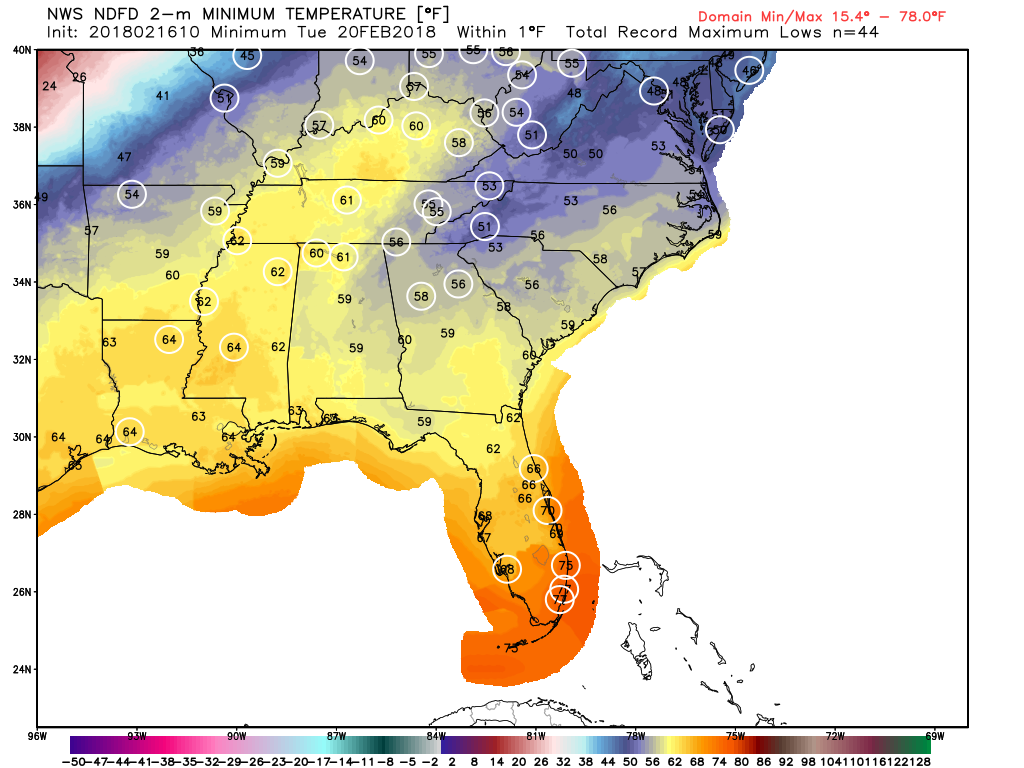
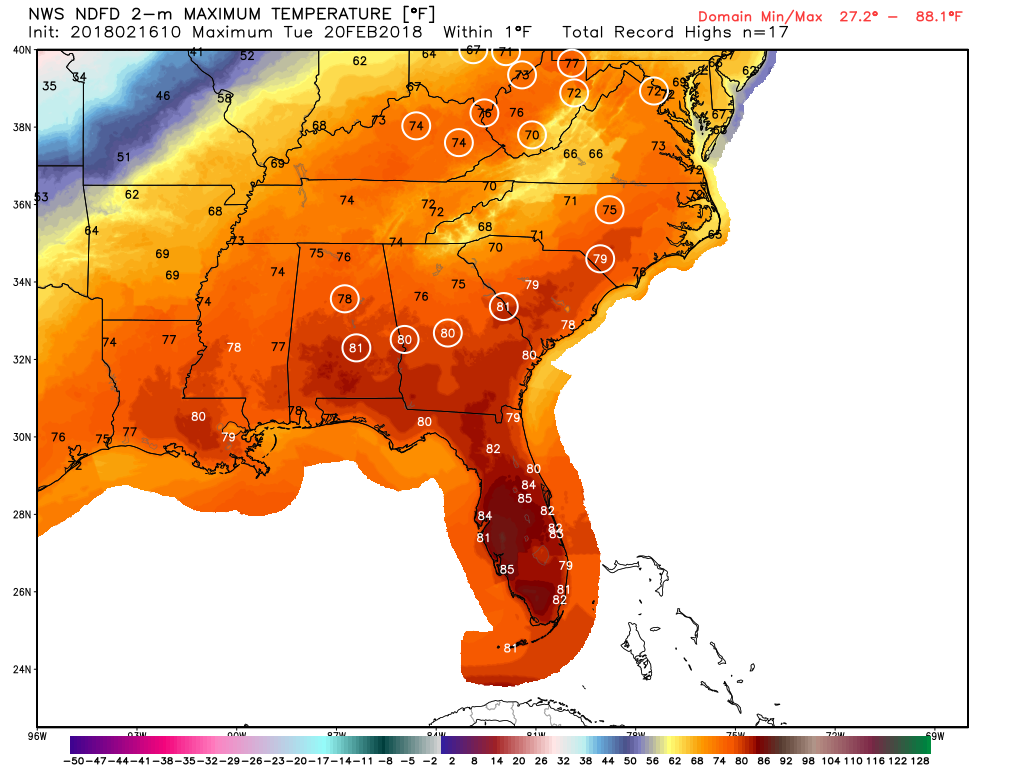
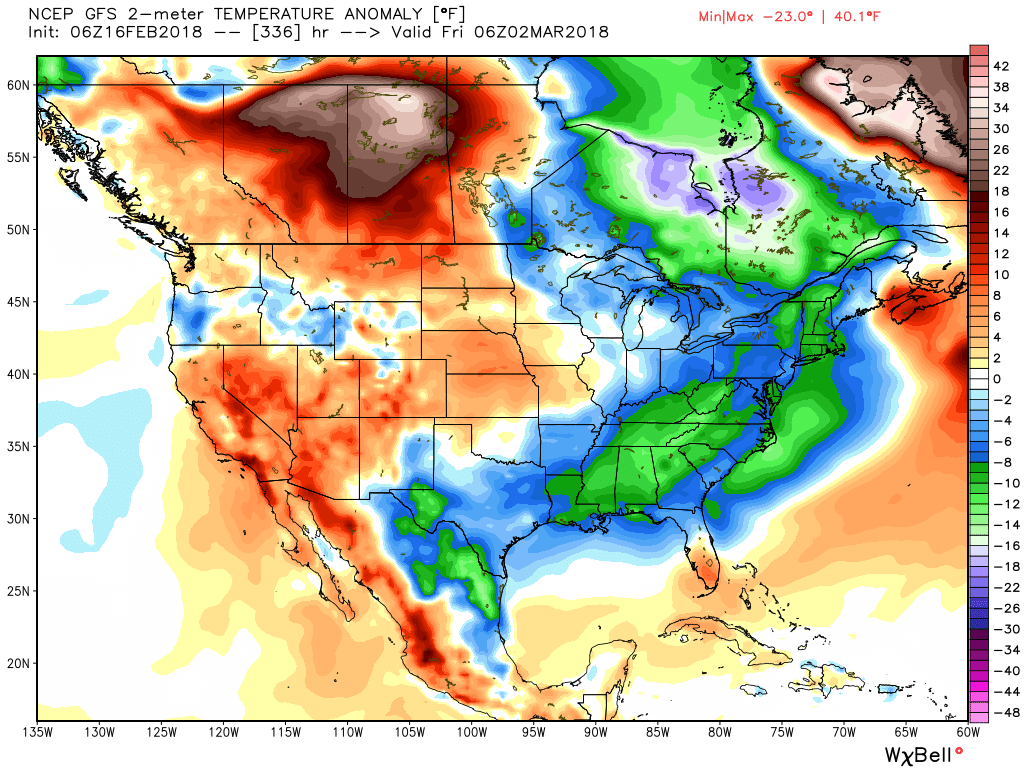
Because of that we are seeing temperatures running some 20-40 degrees above normal. The images in the gallery below are high temp anomalies for the next 7 days. Because temps and moisture levels are running so high, numerous high temp and max low temp records will be broken.
According to the GFS and the Euro... the warmth may end toward the end of the month so don't put those warm clothes away just yet. It's showing colder and much drier air moving in after the 1st.
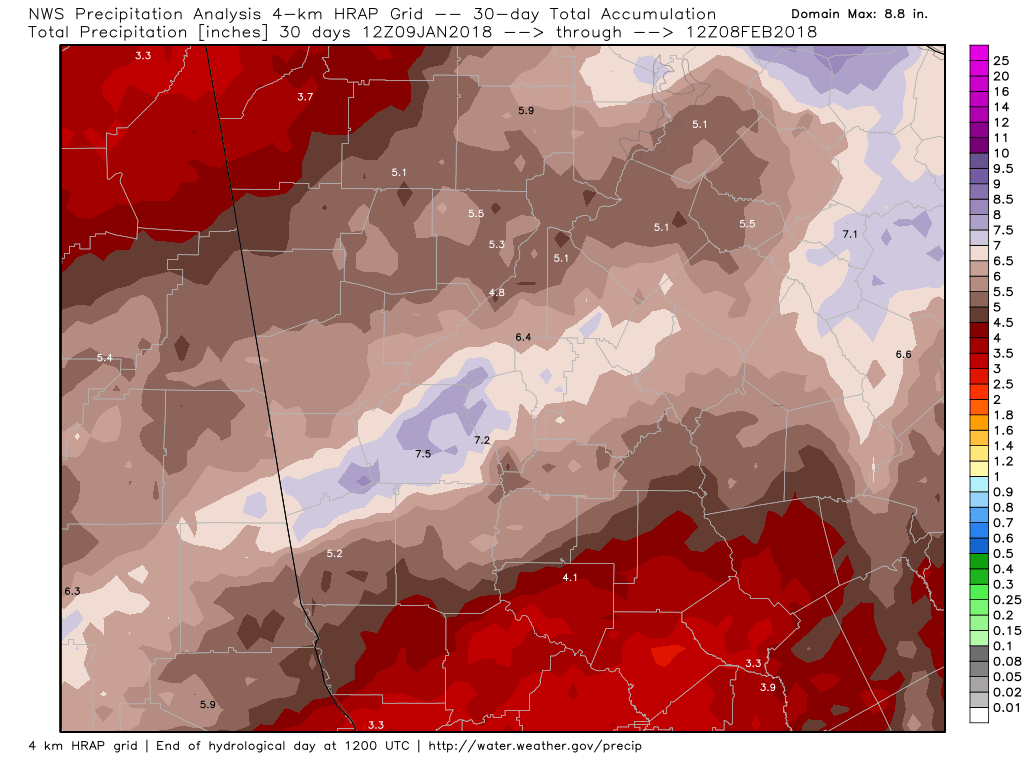
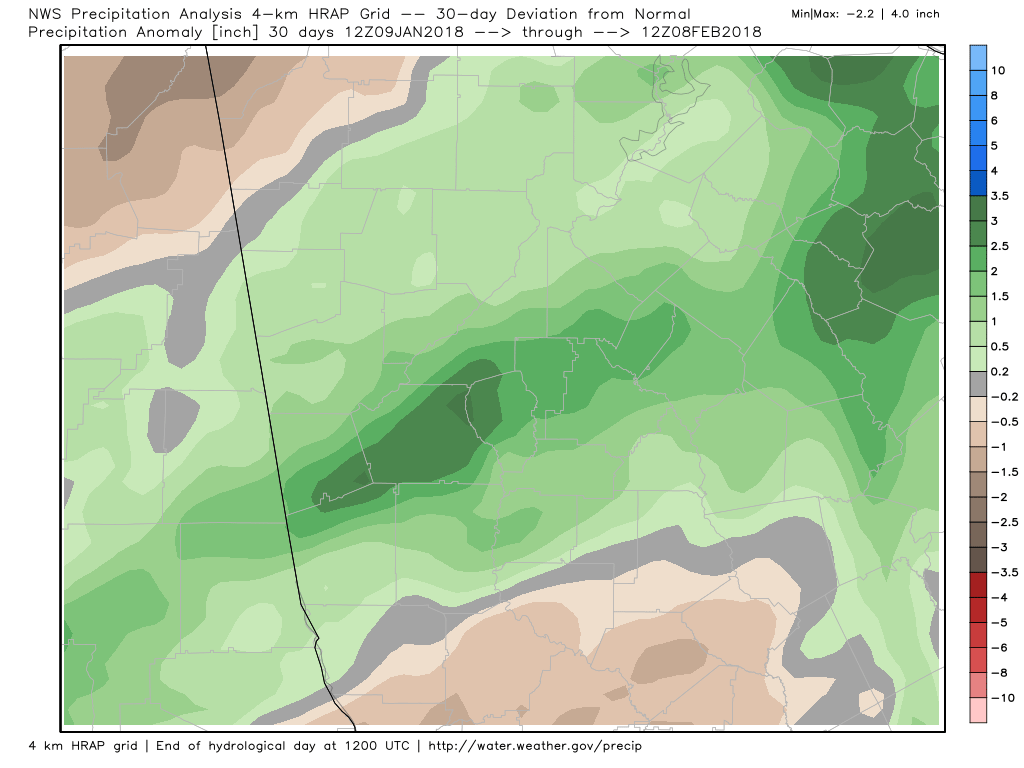
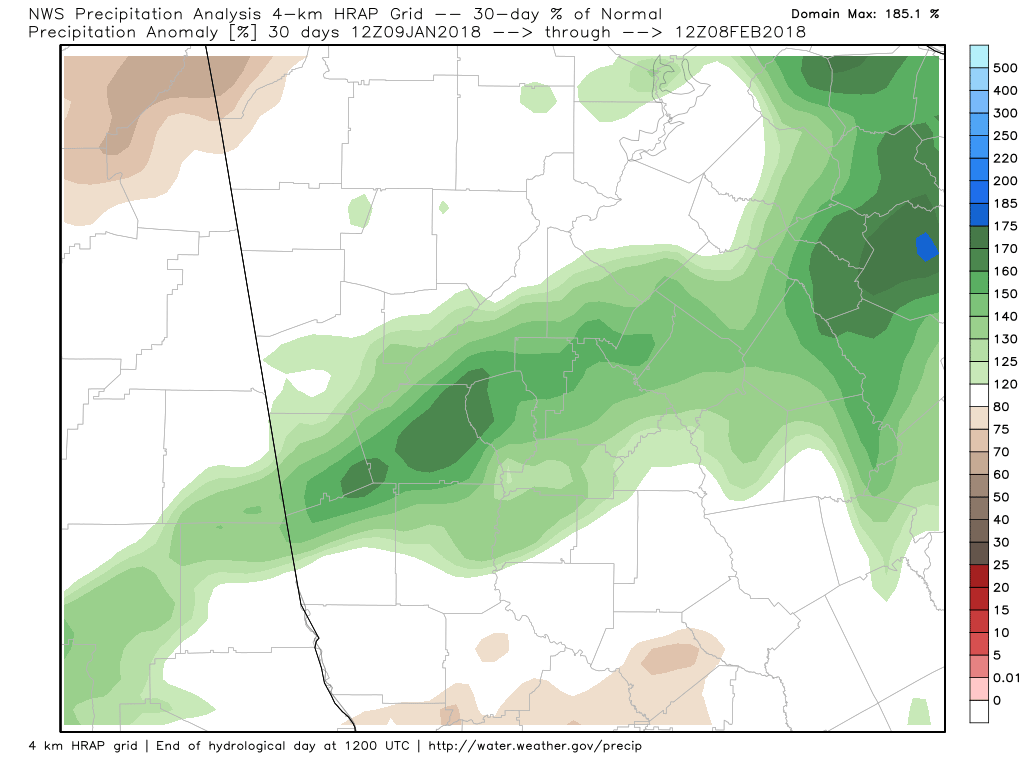
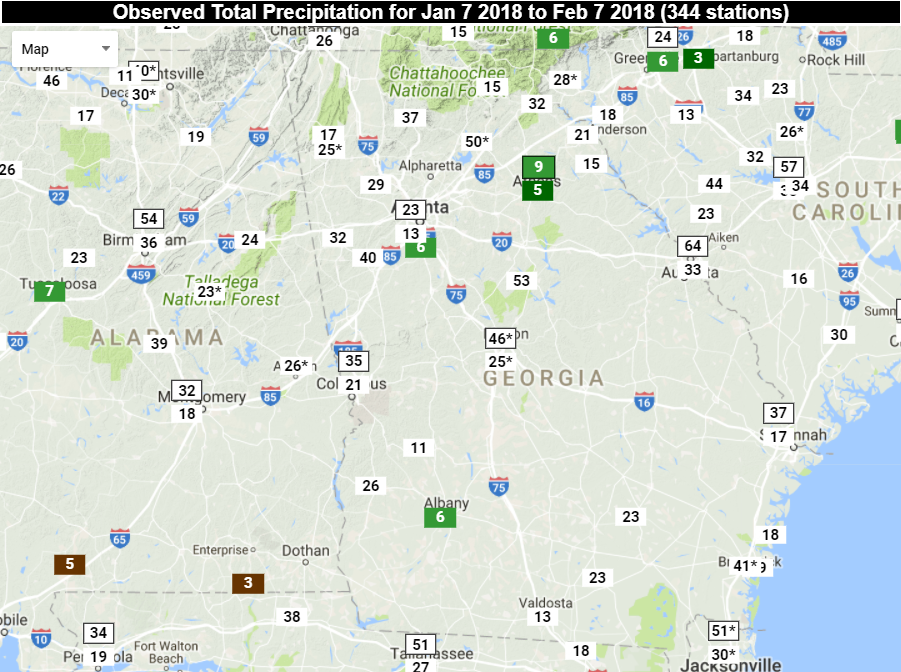
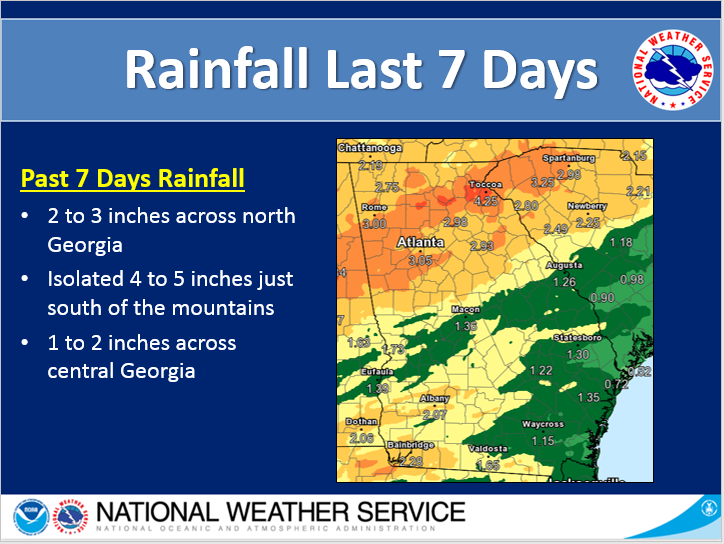
 February 10, 1899 The temperature at Monterey plunged to 29 degrees below zero, establishing record for the state of Virginia. (Sandra and TI Richard Sanders - 1987) February 10, 1973 A major snowstorm struck the southeastern U.S. It produced as much as 18 inches in Georgia, and up to two feet of snow in South Carolina. (David Ludlum) February 10, 1978 As much as eight inches of rain drenched southern California resulting in widespread flooding and mudslides. The heavy rainfall produced a wall of water which ripped through the mountain resort community of Hidden Springs drowning at least thirteen persons. The storm was one of the most destructive of record causing fifty million dollars damage. (David Ludlum) February 10, 1982 Bismarck, ND, experienced its 45th consecutive day of subzero temperature readings which tied the previous record long string of subzero daily lows ending on the same date in 1937. (David Ludlum) February 10, 1987 A storm in the northeastern U.S. produced heavy snow in southeastern Maine. Grand Falls and Woodland received 15 inches, mainly during the early morning hours, while most of the rest of the state did not even see a flake of snow. (The National Weather Summary) (Storm Data) February 10, 1988 Bitter cold arctic air gripped the north central U.S. International Falls MN was the cold spot in the nation with a low of 35 degrees below zero. Record warm readings were reported in southern California, with highs of 78 at San Francisco and 88 at Los Angeles. San Juan Capistrano CA was the hot spot in the nation with a high of 92 degrees. (The National Weather Summary) February 10, 1989 For the first time all month winter relaxed its grip on the nation. The temperature at Brownsville TX warmed above 60 degrees for the first time in six days, ending their second longest such cold spell of record. (The National Weather Summary) February 10, 1990 Thunderstorms developing ahead of a cold front continued to produce severe weather across the southeastern U.S. through the morning hours and into the late afternoon. There were a total of twenty-nine tornadoes in twenty-nine hours, and 245 reports of large hail or damaging winds. Pre-dawn thunderstorms produced high winds which injured at least seventy persons in Alabama and Georgia, and caused more than twelve million dollars property damage. A tornado at Austell GA prior to daybreak injured two persons and caused two million dollars damage. (The National Weather Summary) (Storm Data) February 10, 2010 A second major snowstorm, dubbed Snoverkill and Snowmaggedon 2.0, further buries the Nation's Capital with 10.8 inches of new snow. Schools, businesses and even parts of the Federal government are shut down by blizzard conditions. The city now has a deeper snowpack, 28 inches, than the 20 inches in Anchorage, AK, or 27 inches in Marquette, MI. February 10, 2011 The coldest day in Oklahoma history sees the temperature plunge to -31°F at Nowata, OK. A US National Weather Service station at Bartlesville recorded a reading of -28°F. Both locations break the previous low temperature mark of -27°F set in 1905 and tied in 1930. The Weather Doctor Data courtesy of WeatherForYou 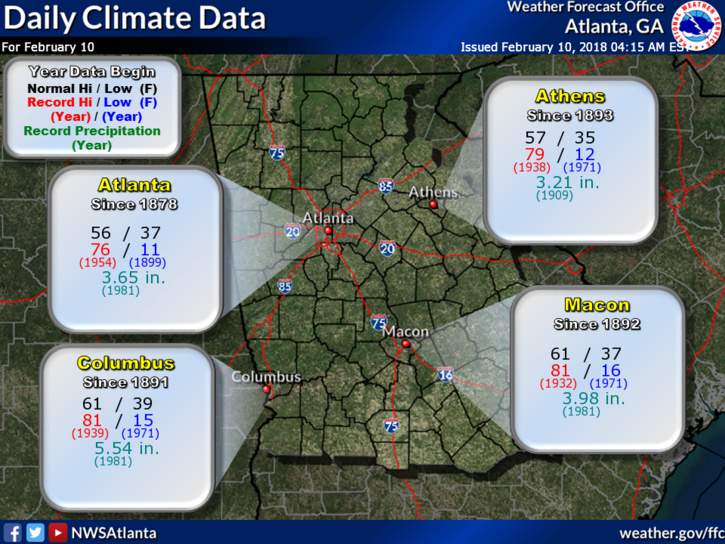 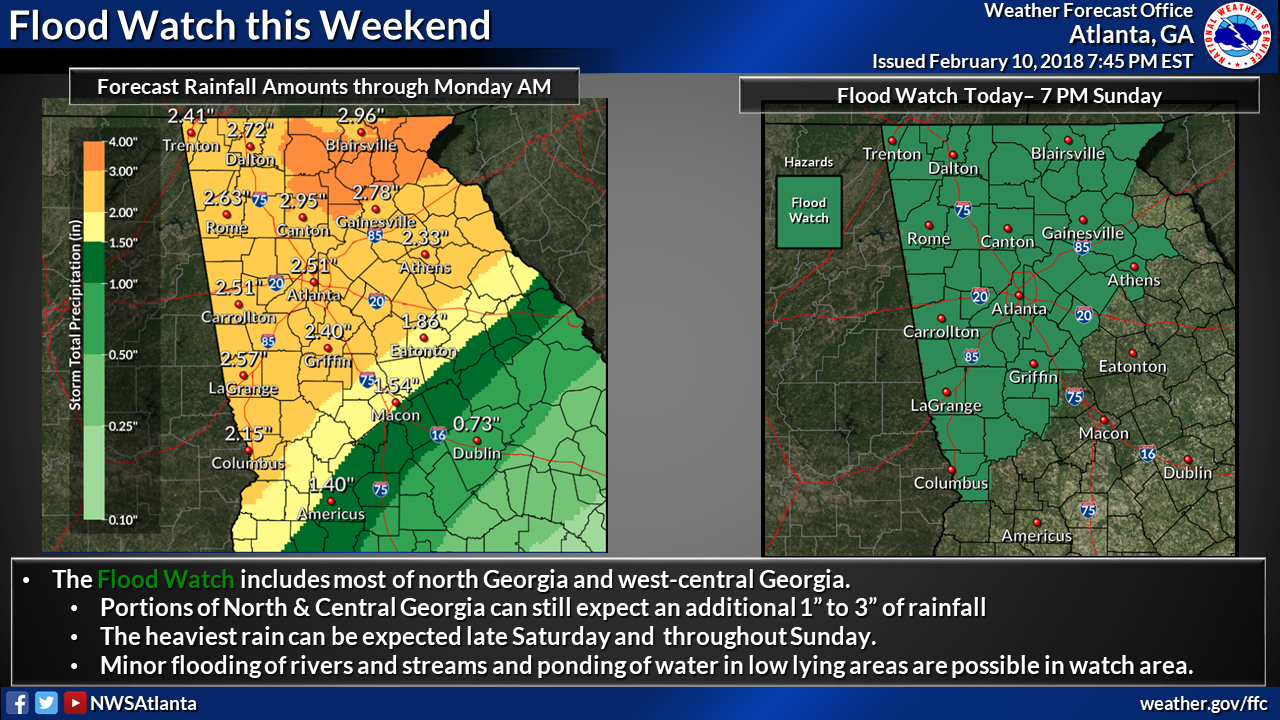 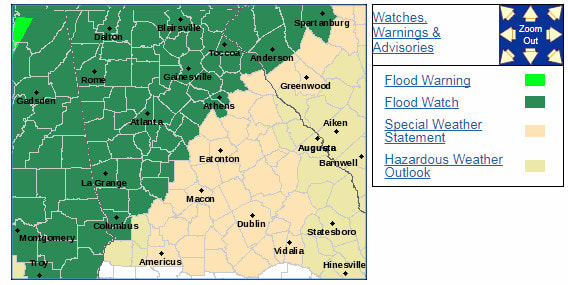 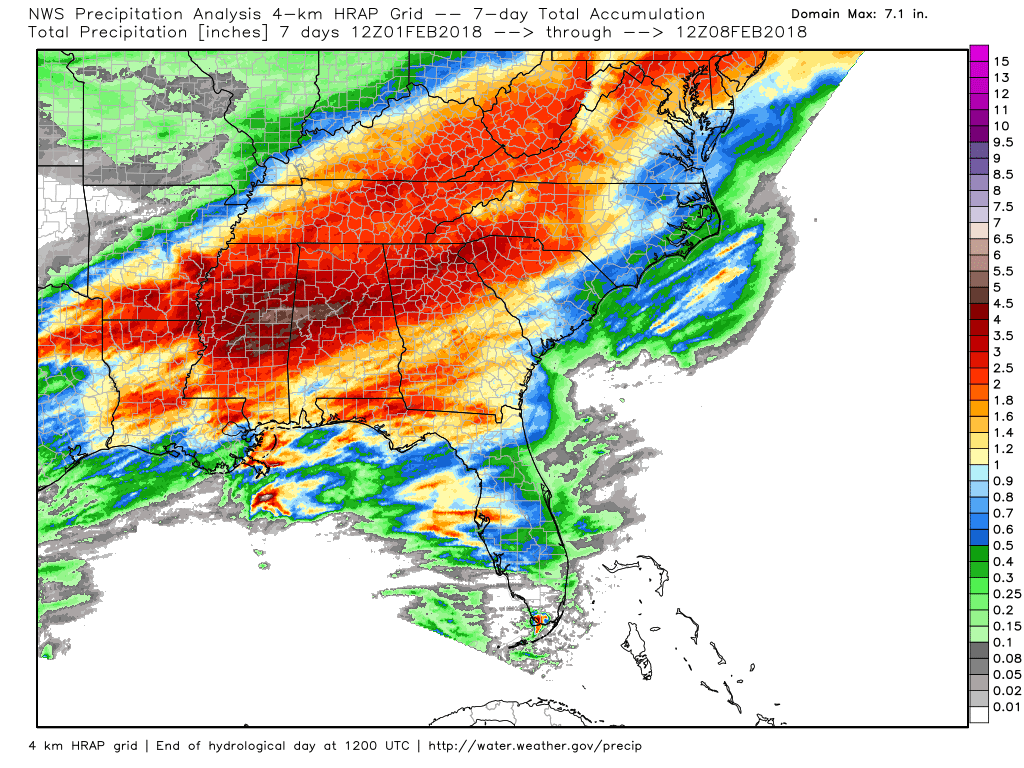 7 Day Southeast Rainfall Totals 7 Day Southeast Rainfall Totals I thought it was a good time to take a look at the rainfall we've had lately as well as what we are expected to have during the upcoming period, so let's look at the past first. The image on the left shows the rainfall totals across the southeast over the last 7 days, and the images below shows what the past 30 days looks like. The image on the left is the 30 day total rainfall, the image in the center is the precipitation anomaly or how much over the normal values that we've received, and the image to the right shows the percentage above normal.
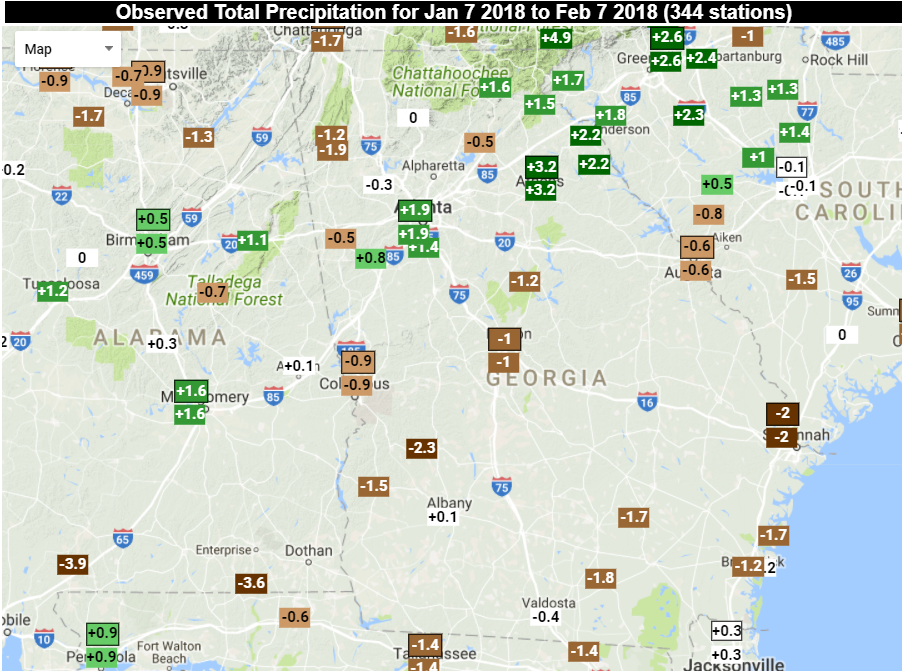
A look at the data from the Southeast Regional Climate Center shows a few places across north Georgia above normal and a few slightly below. The image on the right is a ranking of wettest to driest. The green numbers are rankings in the 10 ten wettest for the period.
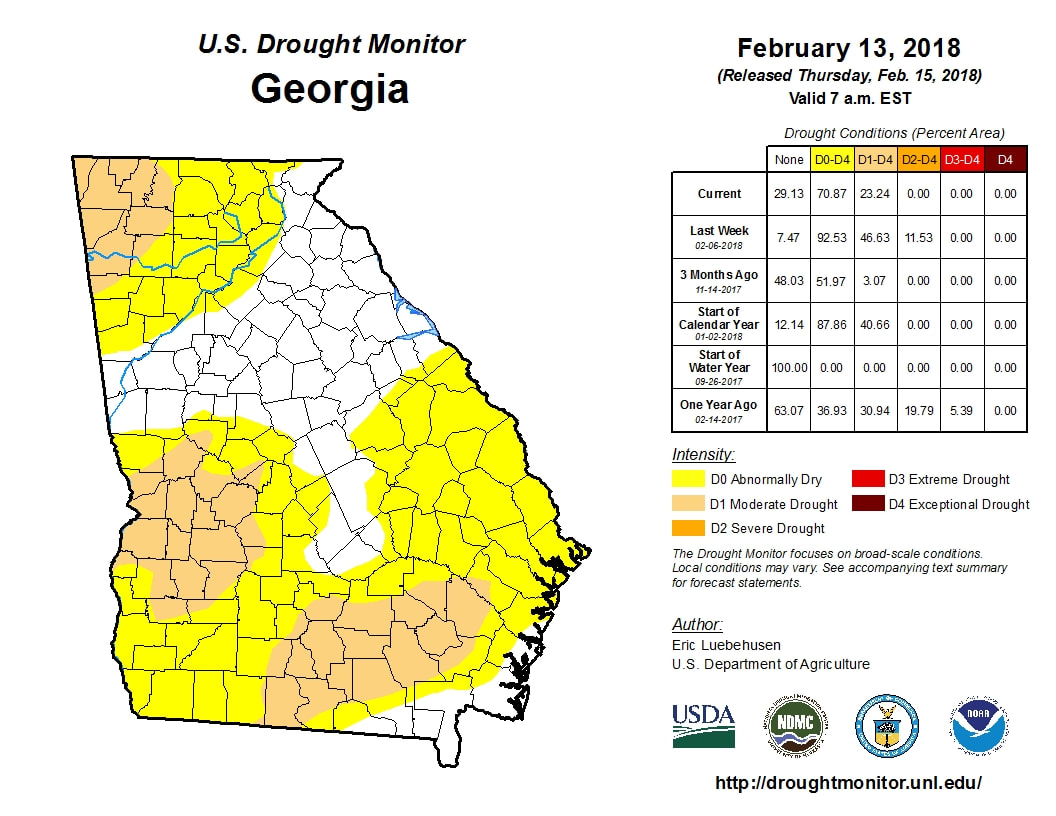
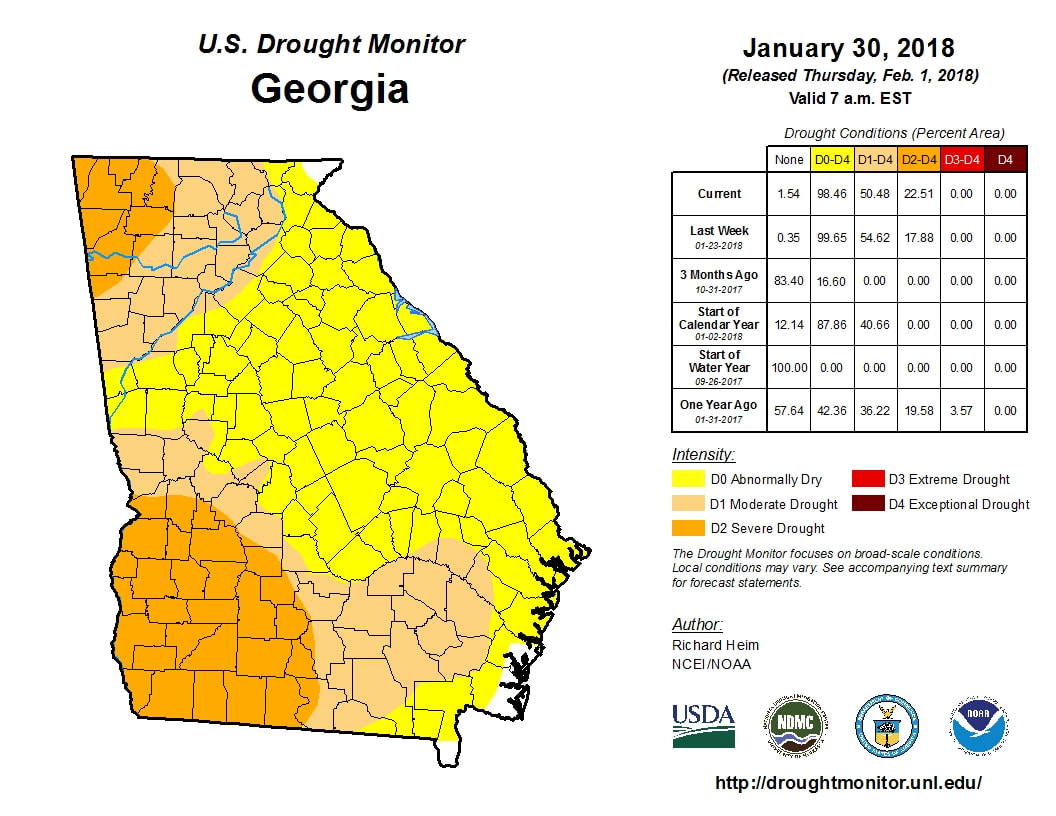
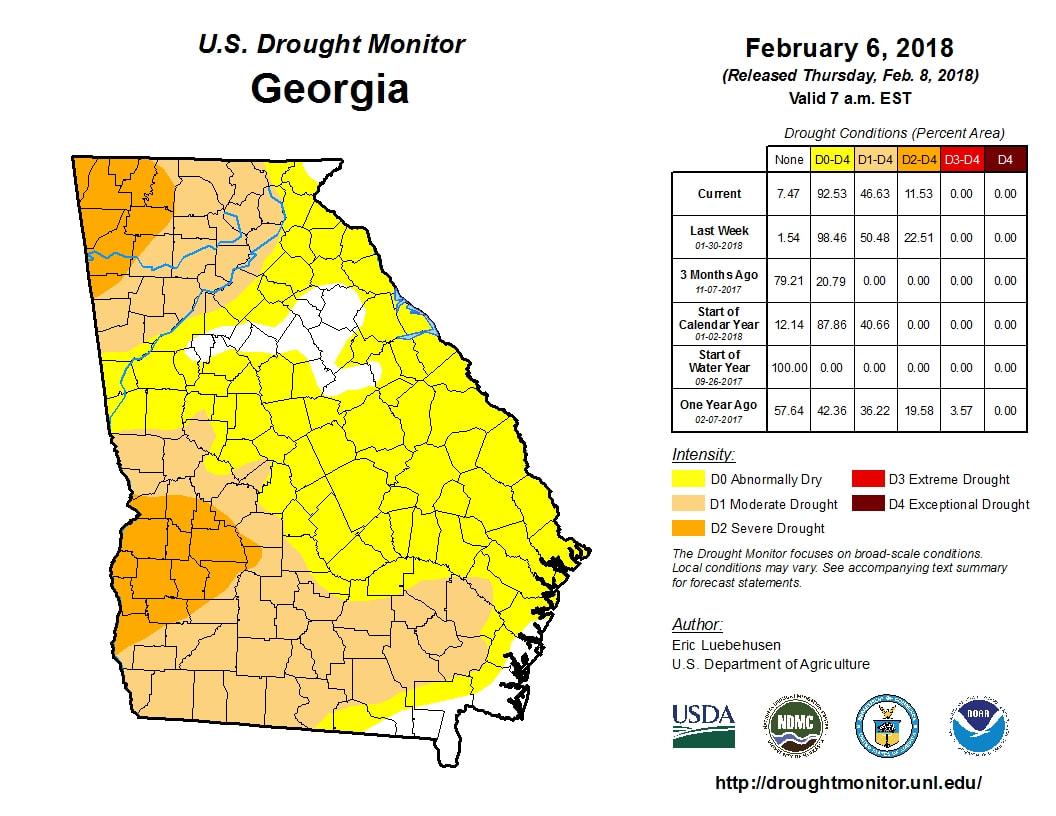
As you can see from the images above, we are generally running a little above normal for rainfall over the last four weeks and that's a good thing, as much of Georgia has been under some level of drought conditions for a while now. The new Drought Monitor report that was released today shows that some areas in Georgia have had a reduction in the drought levels since last weeks report. The D2-D4 levels dropped about 11% from last week, and are now covering about 11% of the state versus 22% previously. This time last year 20% of Georgia was at the D2-D4 level. Here's a look at the report from last week (left) and today (right) and you can find these maps and more here: http://www.daculaweather.com/4_drought_state.php
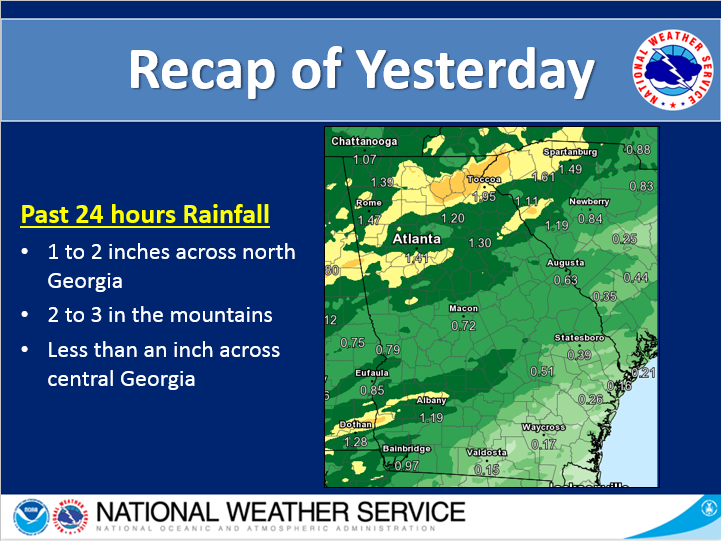
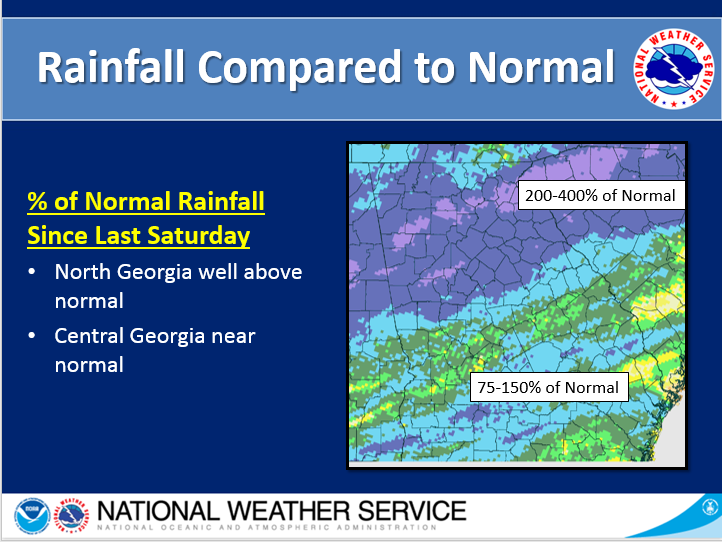
So on to the recent rainfall. The first image shows the rainfall for the last 24 hours and you can see that we've had a generous amount of rain in many places across north Georgia. The last 7 days rainfall has been well above normal for this time of year and amounts to 200-400% above normal.
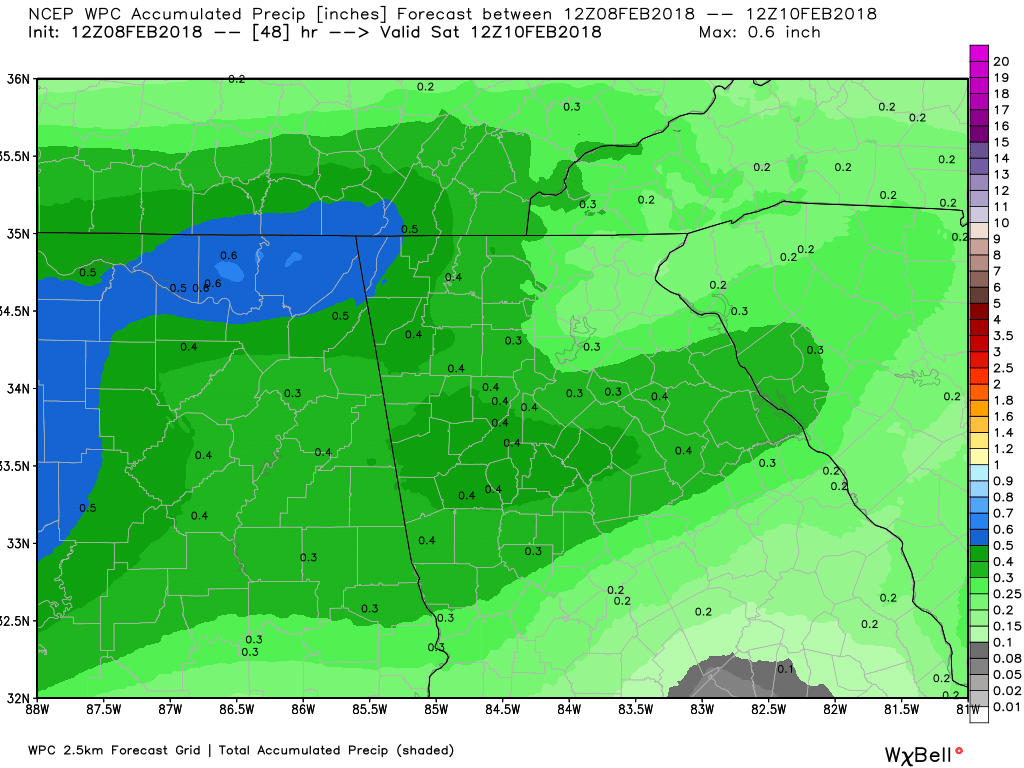
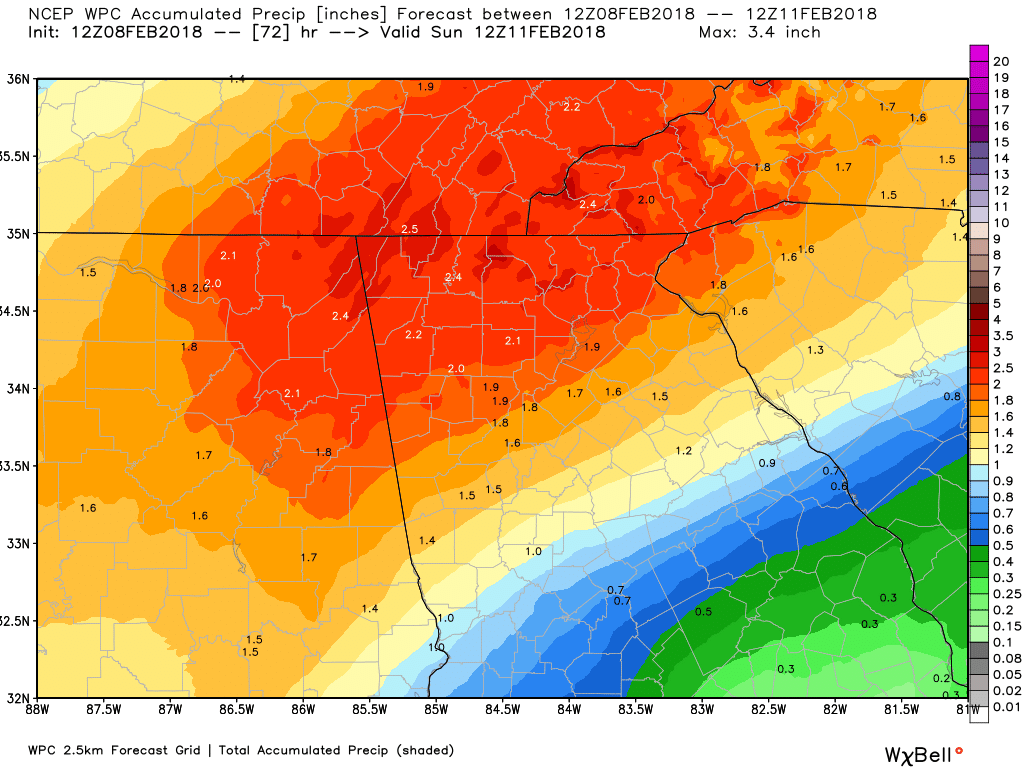
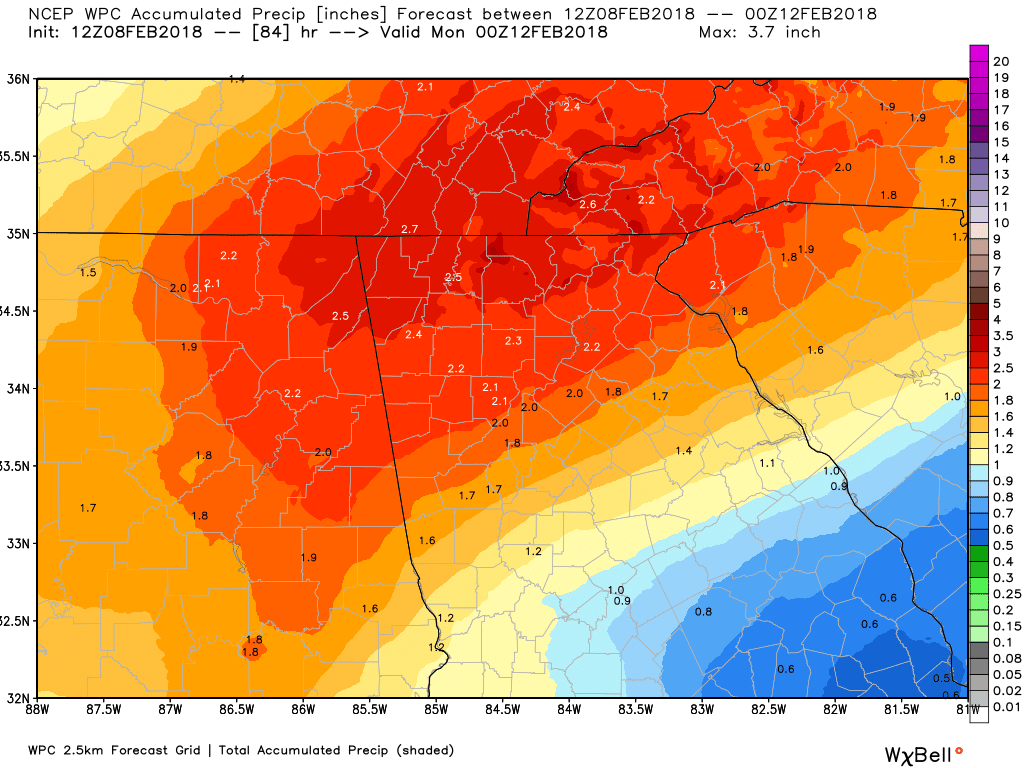
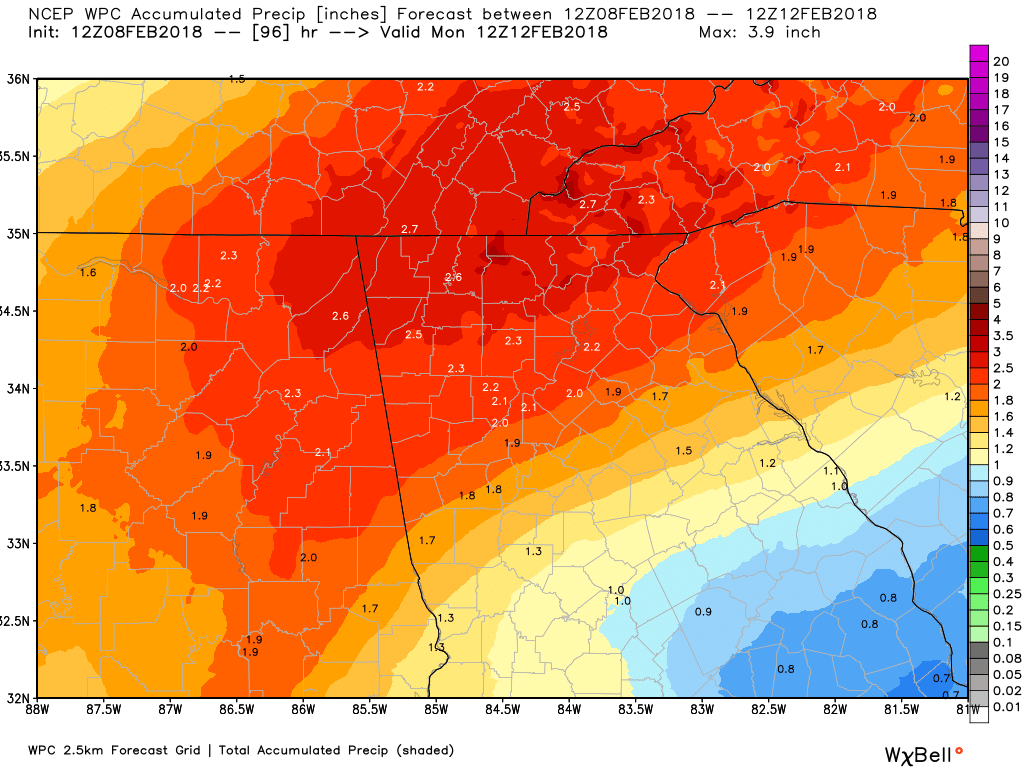
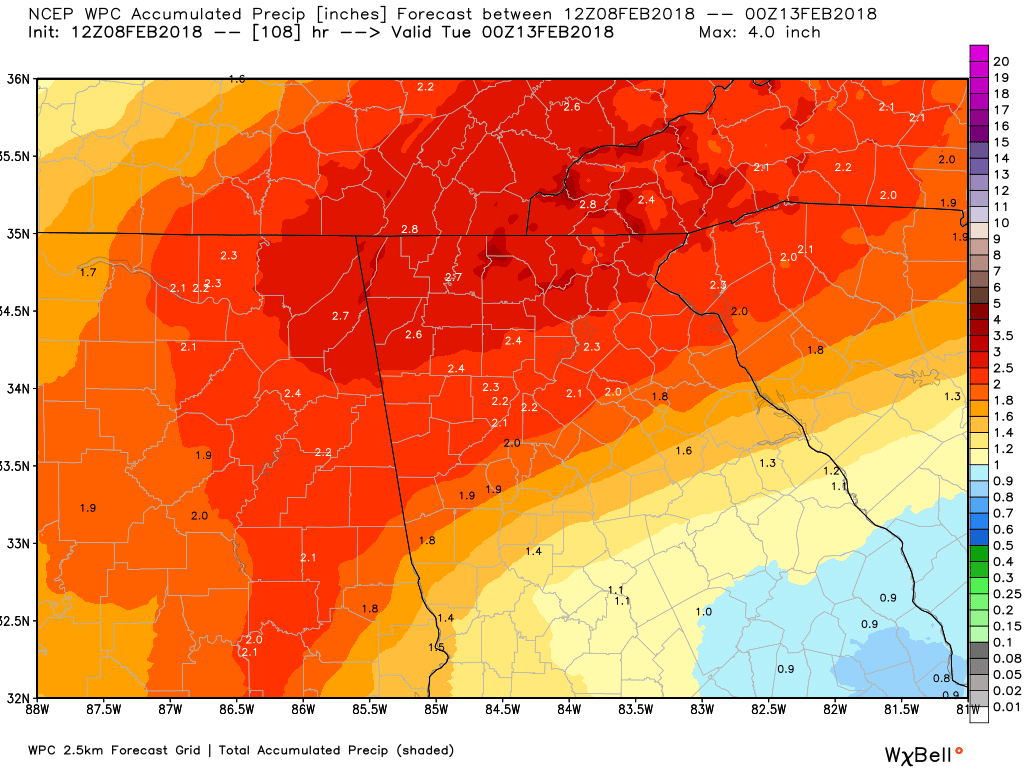
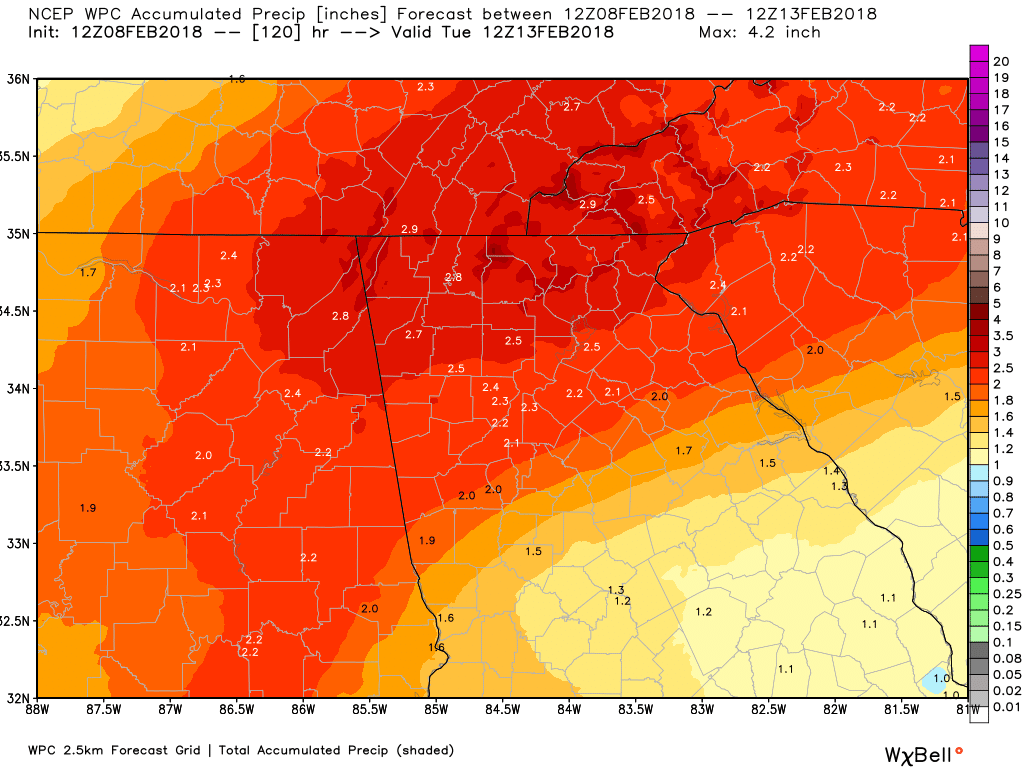
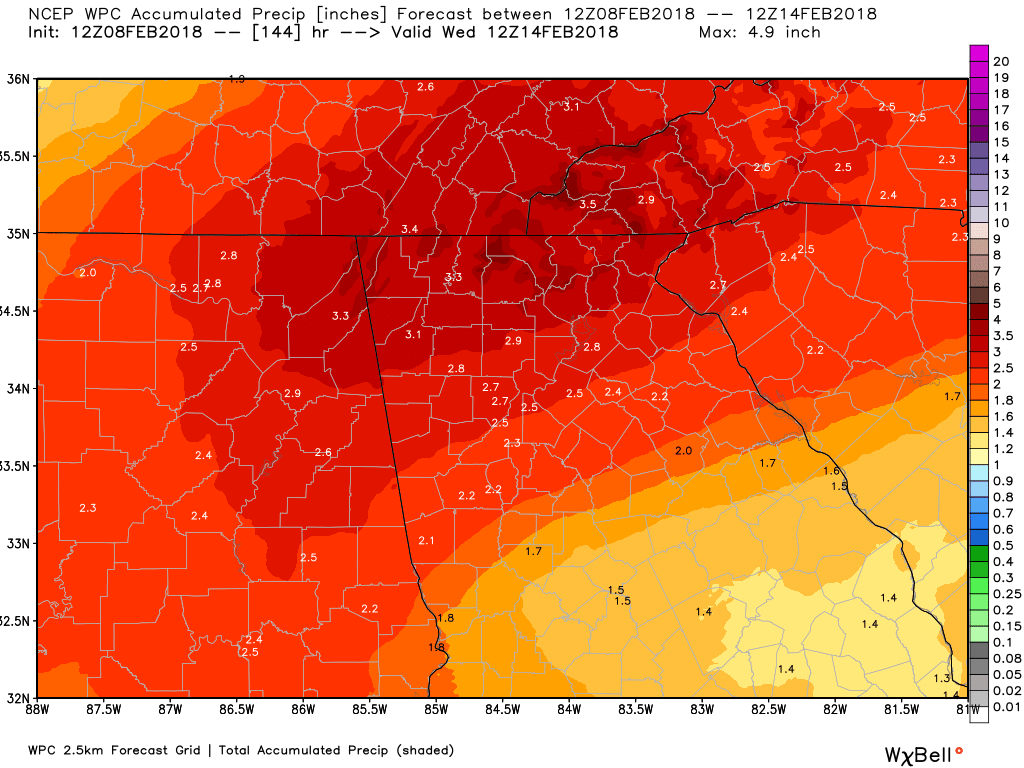
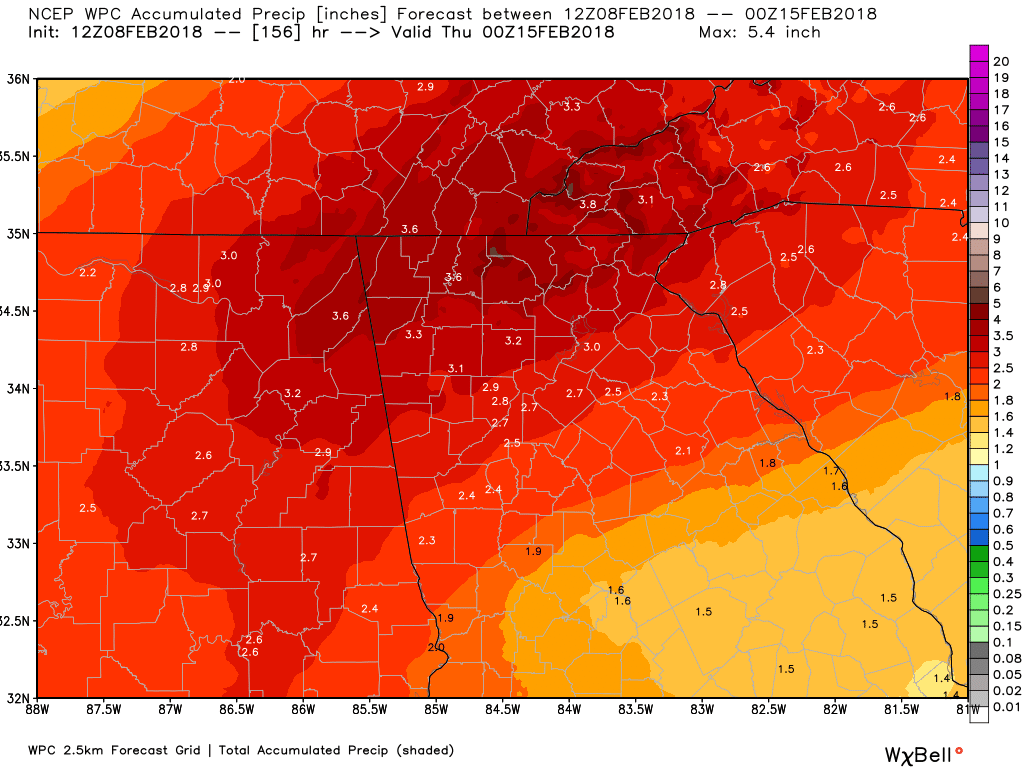
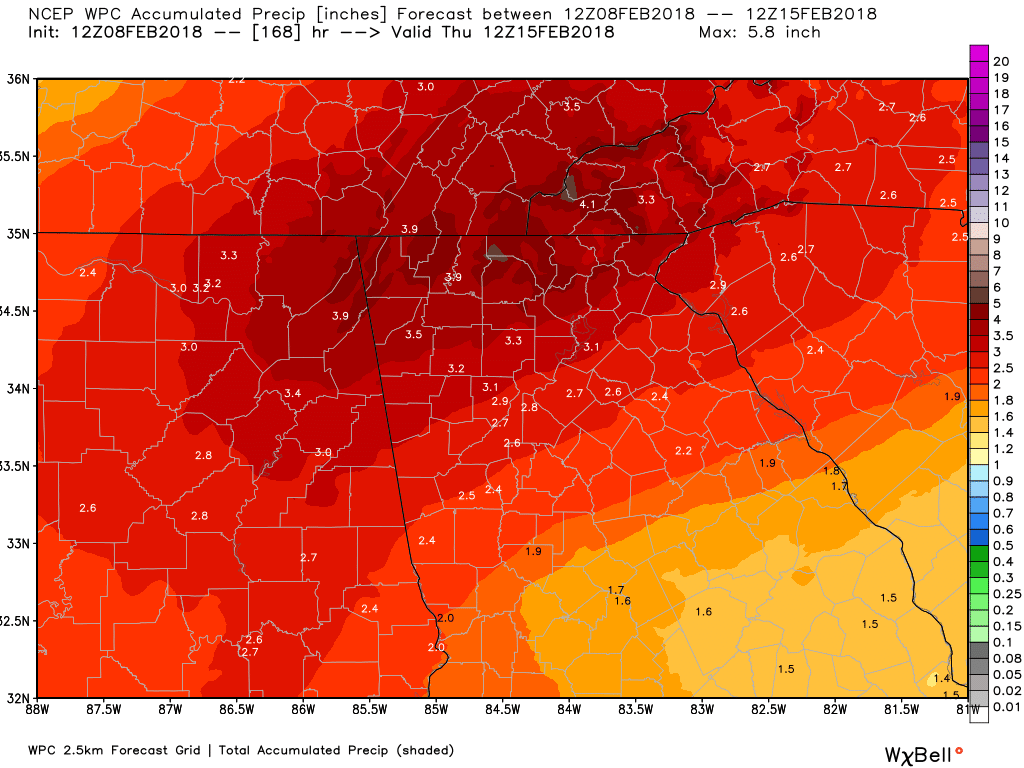
And we're not done! Rainfall this weekend may be heavy and due to all the rainfall over the last 7 days, we may be looking at some flash flooding potential over the weekend due to excessive runoff. Here's a look at the rainfall potential for the weekend from the Atlanta NWS office. 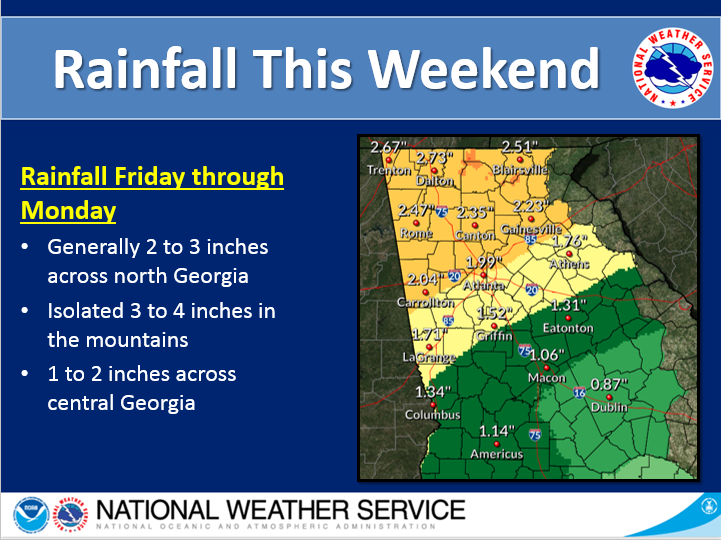 But it doesn't stop there, rain chances will continue into next week, and here's a look at the Weather Prediction Center's (WPC) forecast for the next 7 days, every 12 hours. Enjoy the warm rainy weather because it's not like we have a say in what happens. :-) |
Archives
March 2019
Categories
All
|
OLD NORTH GA WX BLOG


 RSS Feed
|
Never base important decisions on this or any weather information obtained from the Internet. Always have a backup method of receiving weather information such as a battery powered weather radio.
Copyright © 2018 NorthGeorgiaWX.com and DaculaWeather.com 
|