|
I wanted to save the records that the Atlanta National Weather Service generated a few days ago, so here they are. Again, all data from the NWS except the images toward the end of the post, and those are all from WeatherBELL. The original NWS page can be found by clicking here.  Image from the Atlanta NWS office 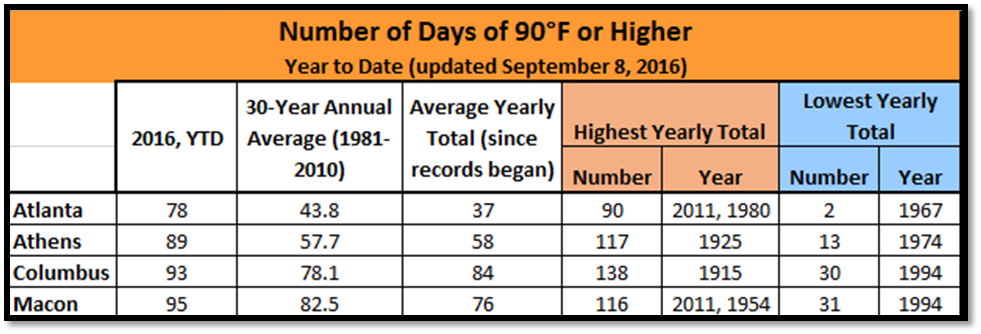 Image from the Atlanta NWS office Temperature Stats (°F) for June through August...You can click on the name of the four major climate sites to see a graph of the temperatures compared to the average.
Temperature Extremes (°F) for June through August...
Precipitation Rankings for June through August...You can click on the name of the four major climate sites and to view a graph of the precipitation values compared to the average.
Precipitation Extremes for June through August...
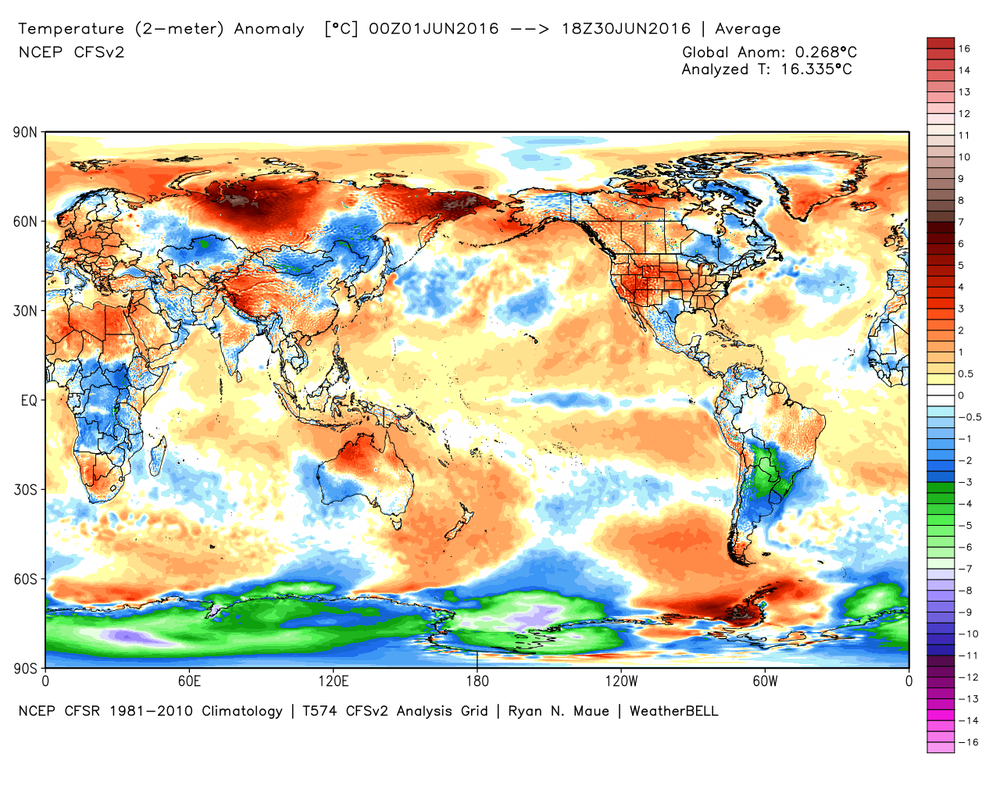
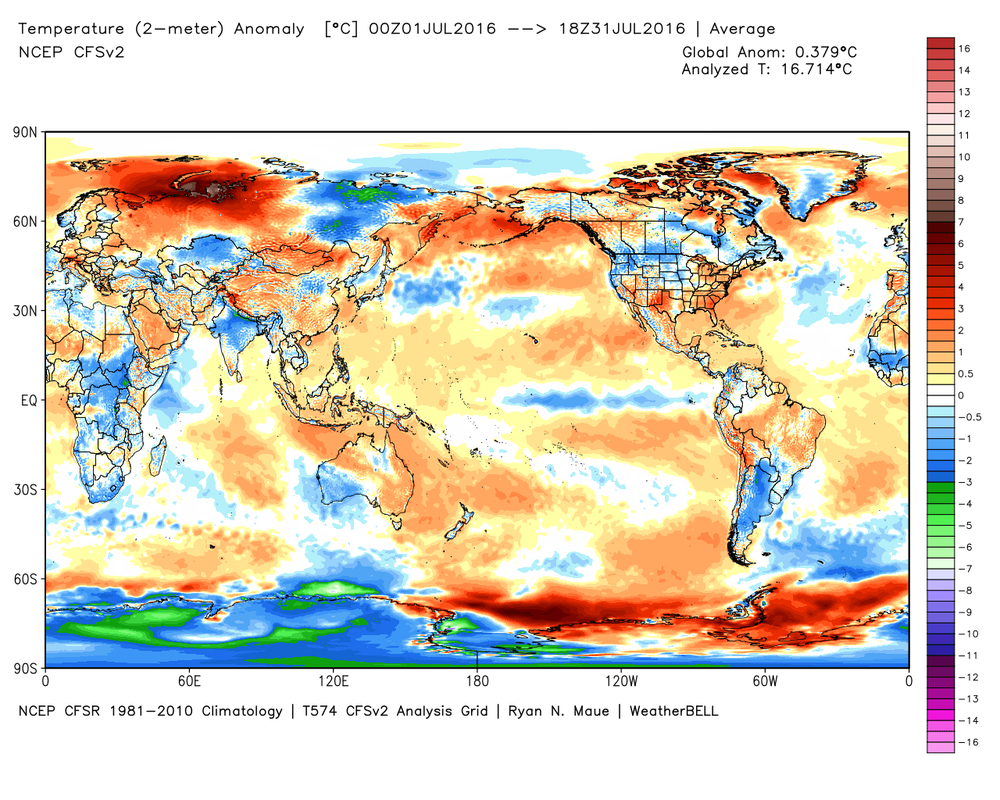
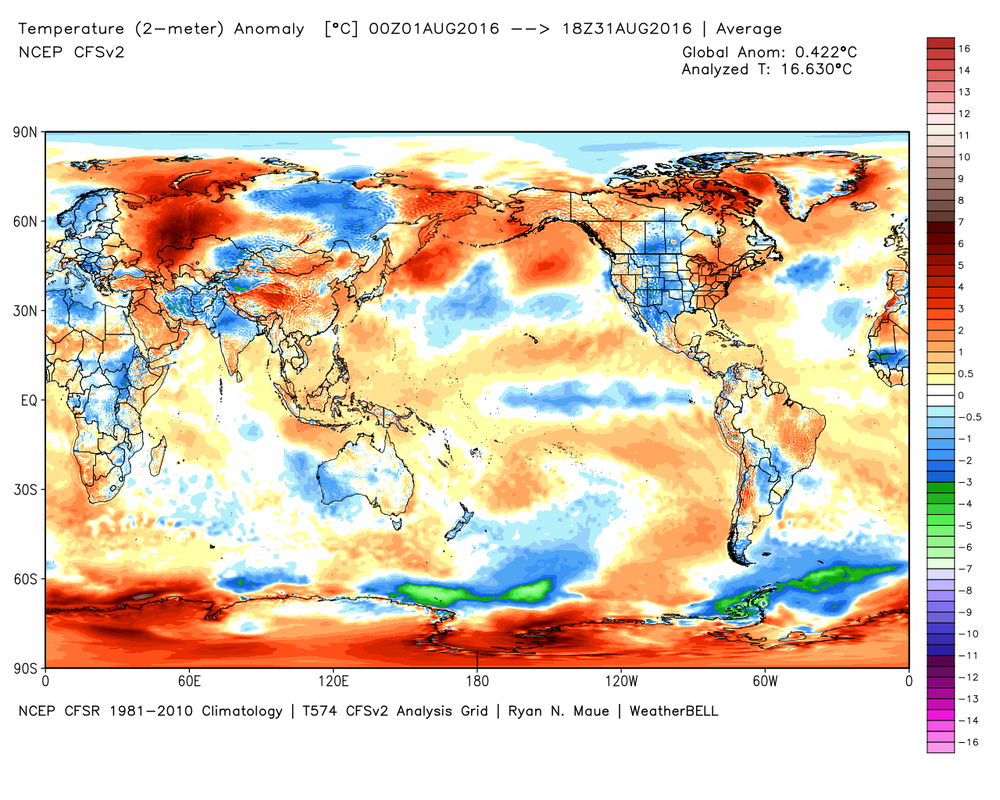
Precipitation Analysis Maps for the last 90 days...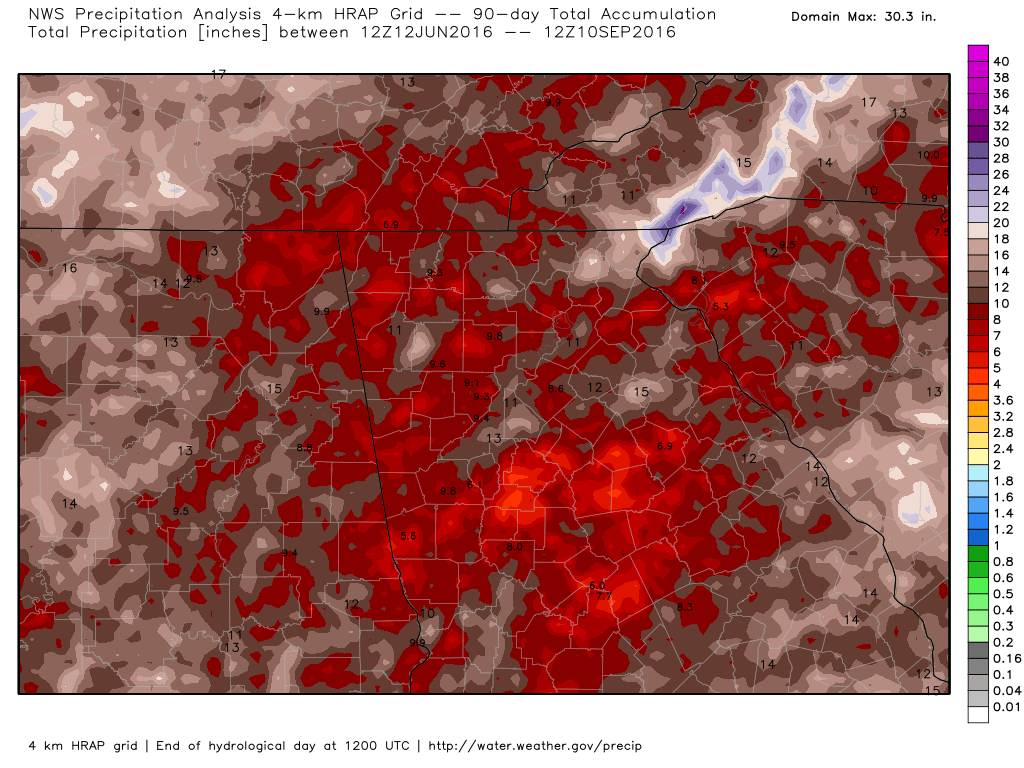 Georgia view of the last 90 days of precipitation - Image from Dr. Ryan Maue and WeatherBELL 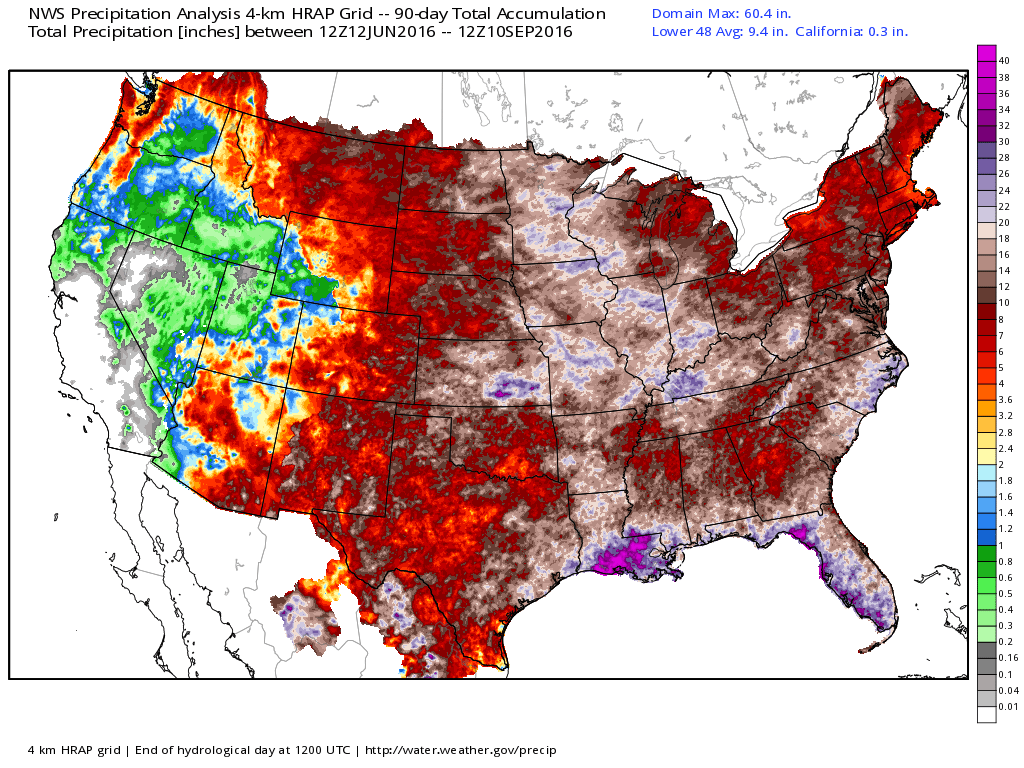 Conus view of the last 90 Days of precipitation - Image Dr. Ryan Maue and WeatherBELL. Temp Anomaly Maps...These maps are from Dr. Ryan Maue and WeatherBELL. Click an image for a larger view.
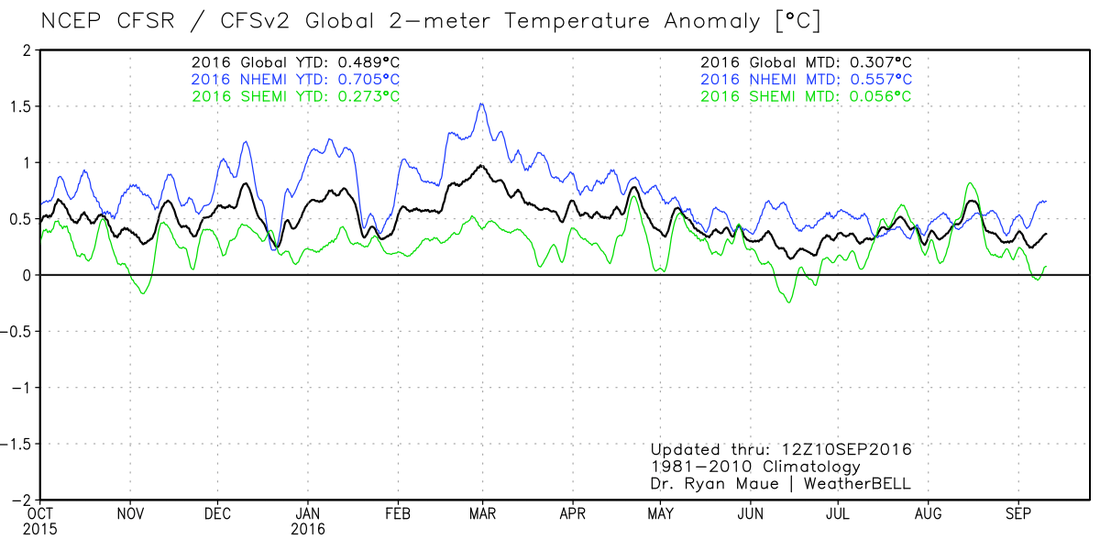 Global Temp Anomalies by Hemisphere
0 Comments
|
|
OLD NORTH GA WX BLOG
 RSS Feed
|
Never base important decisions on this or any weather information obtained from the Internet. Always have a backup method of receiving weather information such as a battery powered weather radio.
Copyright © 2018 NorthGeorgiaWX.com and DaculaWeather.com 
|